NGS Upload
1 General
- Type: - Matrix Upload
- Source code: not public.
2 Brief description
Load information from NGS data.
3 Background
Next-generation sequencing (NGS) methods are a set of different strategies to sequence DNA and related molecules. Because of extreme price reduction of sequencing per basepair as well as the huge spectrum of implementation, NGS is becoming a method of choice for many studies. Particularly, expression analysis is one of the most common tasks. In this sense NGS data is complementary to mass spectrometry-based proteomics data. We can therefore cover all steps of expression regulation starting from epigenetics to the protein level. That’s why it is important to include an NGS upload activity to the Perseus workflow.
4 Parameters
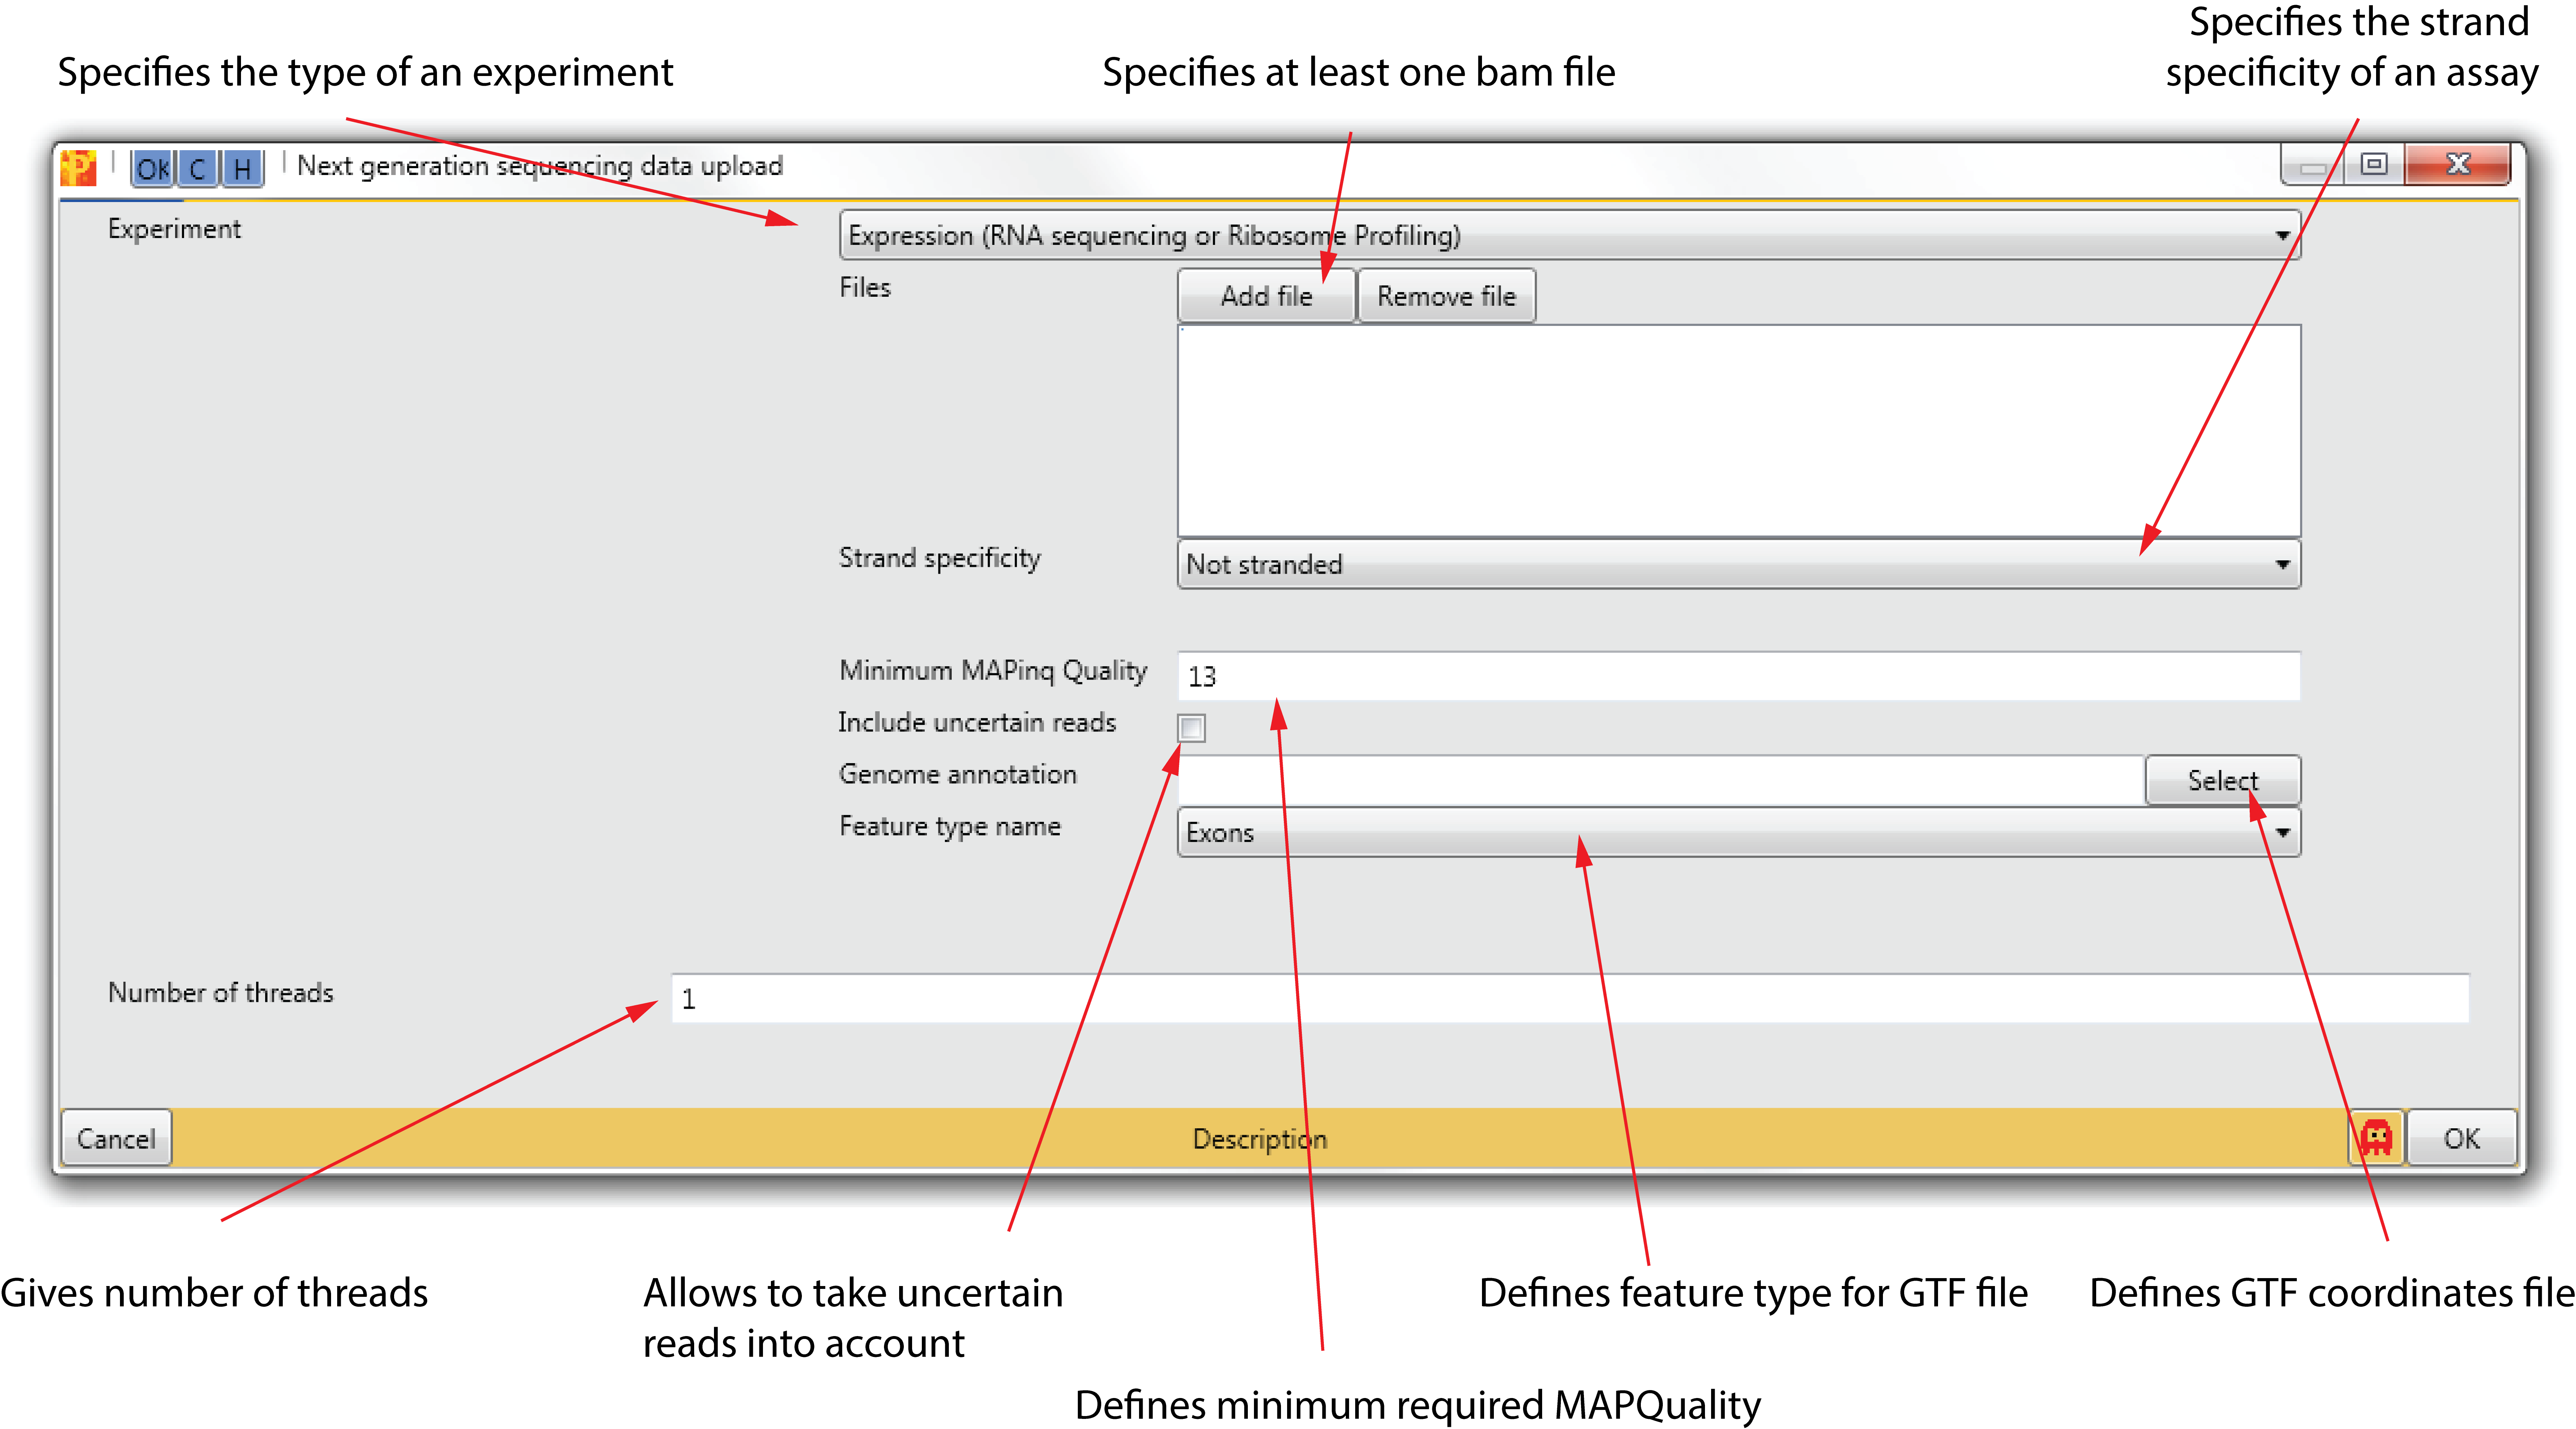
4.1 Experiment
It specifies the type of NGS experiment the data is derived from (default: RNA sequencing and ribosome profiling).
4.2 Files
With the two buttons “Add file” and “Remove file” it is possible to select BAM Binary-sequence Alignment Format files. This format is generally used as a compact way to save an alignment and at the same time allowing efficient random access.
Perseus doesn’t require an index file.
4.3 Strand specificity
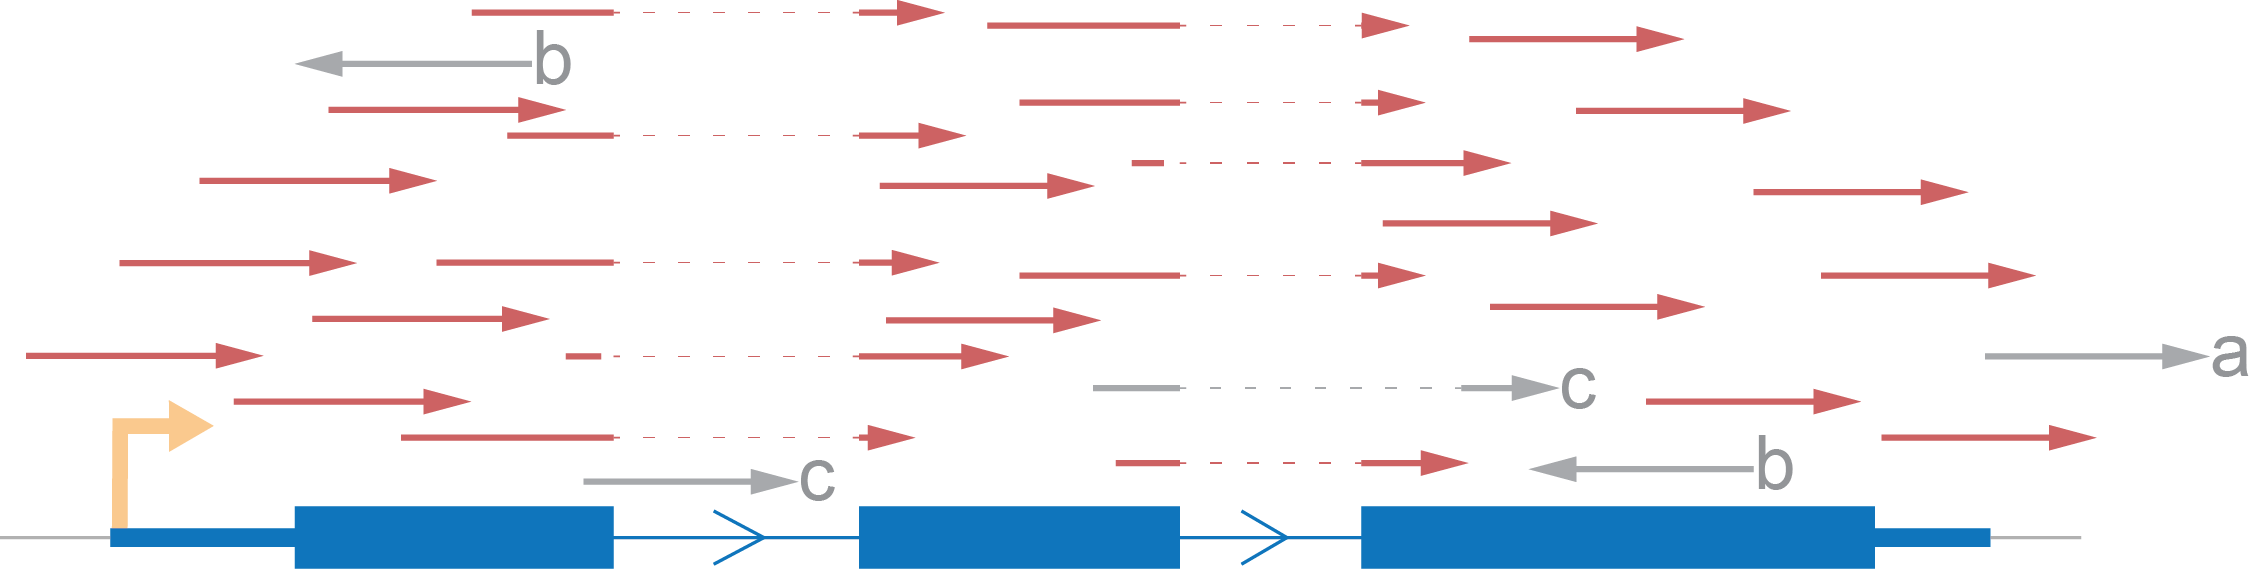
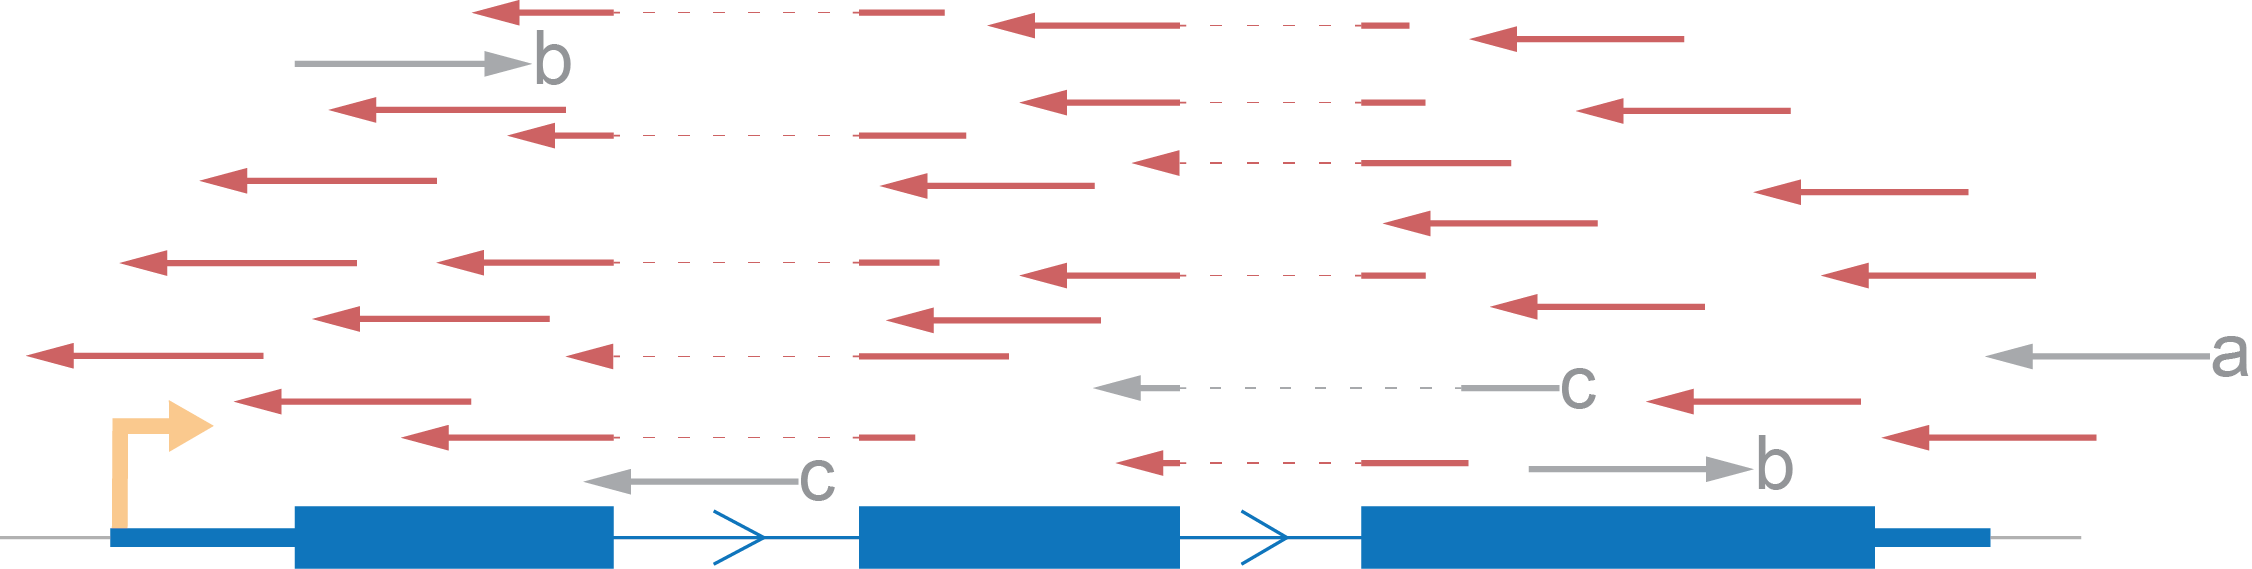
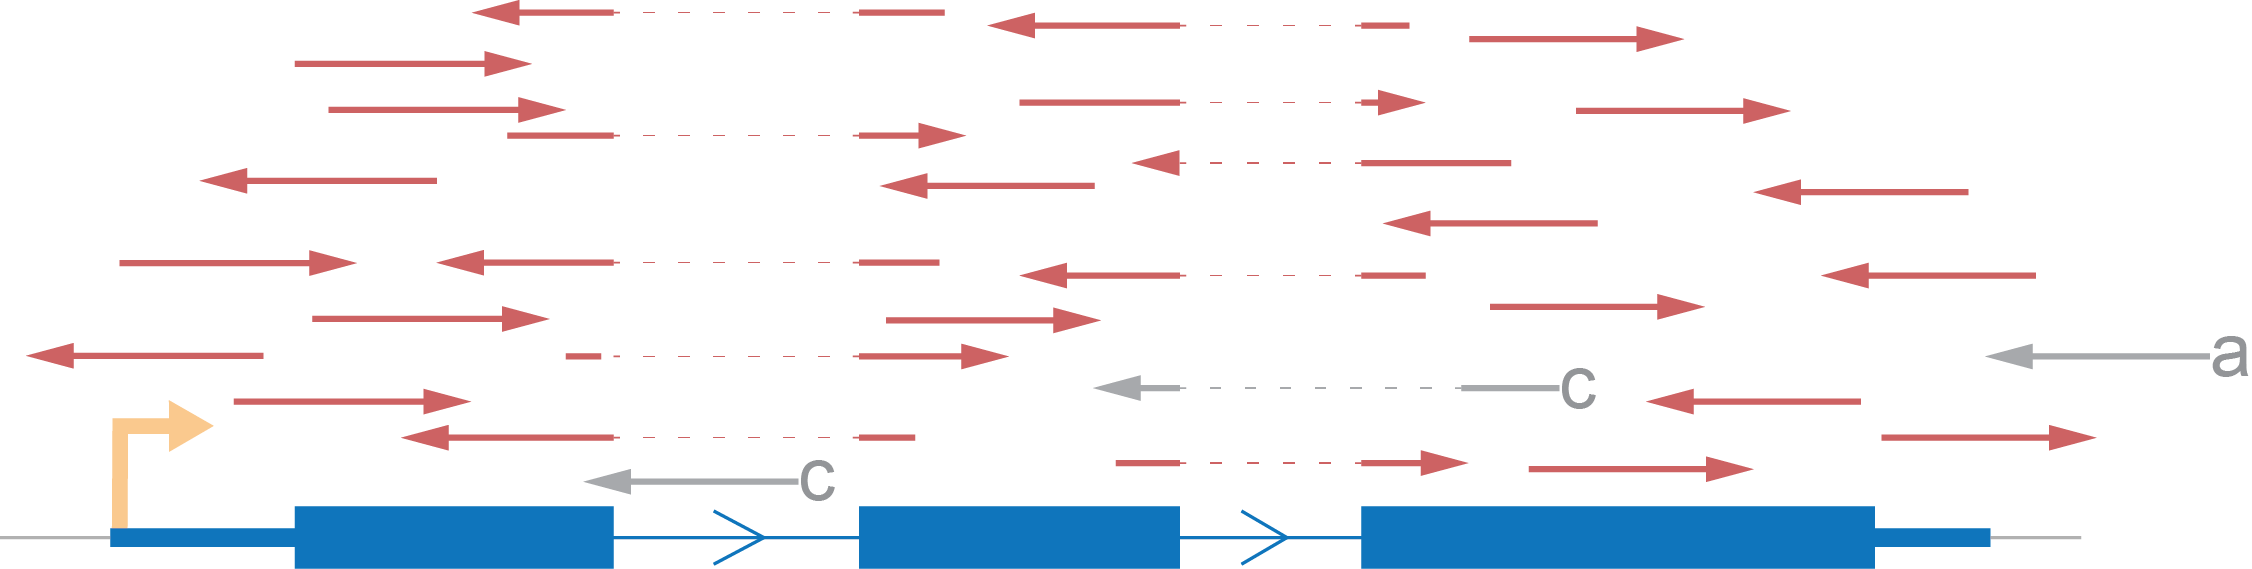
It describes which RNA library preparation method was used. Depending on this, reads will mostly be aligned to the same (sense) or opposite (anti-sense) strand as the feature. Alternatively, reads can be aligned to both strands (not stranded).
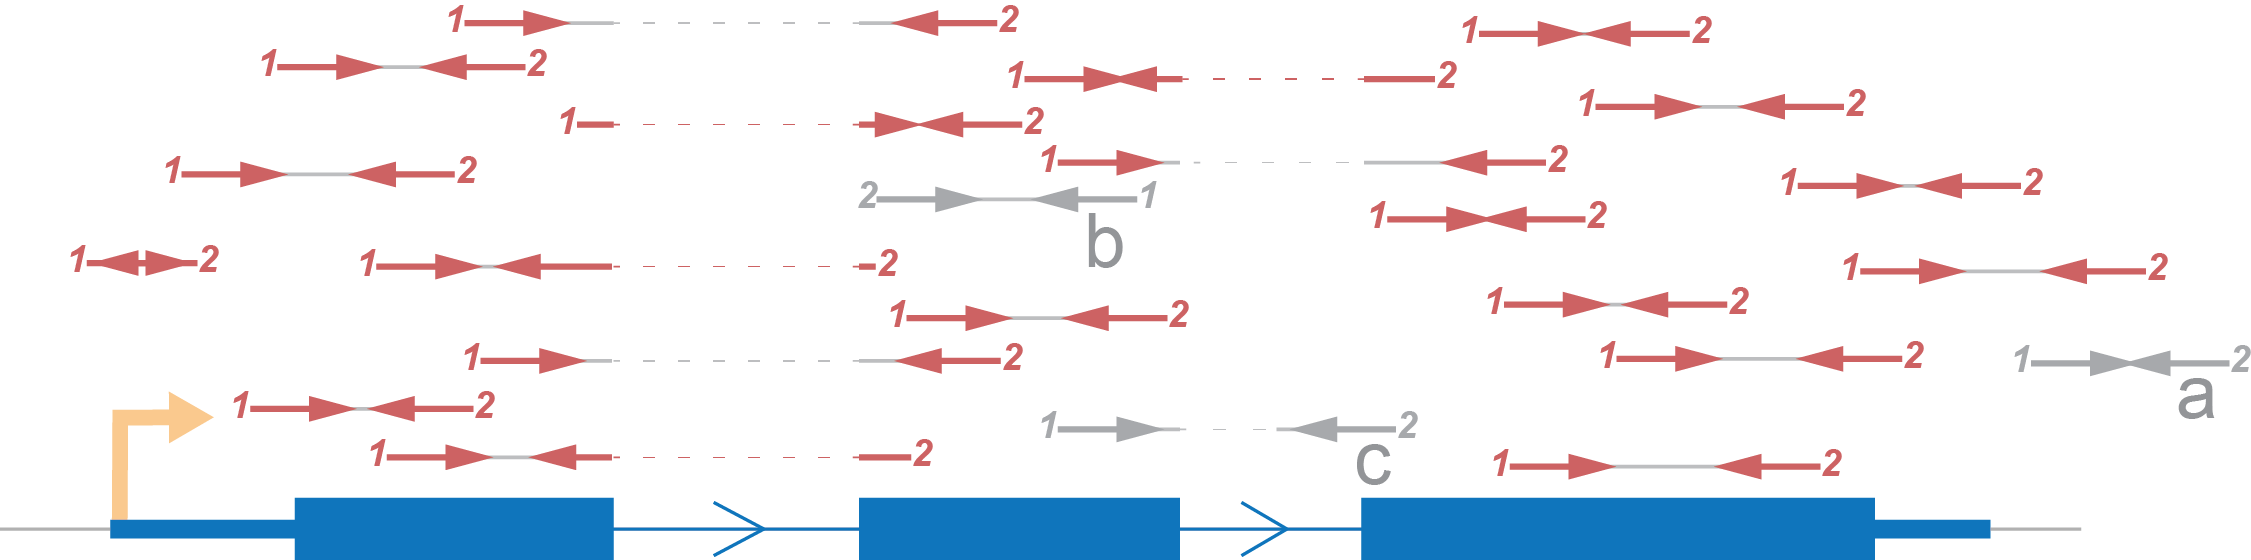
Let’s demonstrate an expected distribution of reads according to an imaginary gene, consisting of one transcript, using each type of strand specificity. All reads marked red are those which we will take into account. Reads marked grey will be excluded from the coverage calculation.
- We rule out reads with a mark because there is no intersection between them and the gene.
- Also, we skip b marked reads because they have an opposite direction to that which we expect.
- Lastly, we eliminate reads which don’t fit with the annotation (c) although such reads can potentially be evidence for another isoform of the gene.
Paired end sequencing produces two reads from one fragment and they should be from different strands (if reads is aligned to the same strand, we exclude such pairs).
For simplicity of visualization let’s represent paired end reads like this (Figure 4)
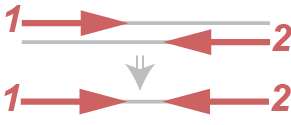
We represent the paired end read like this for short. Definition of a, b and c marked reads is similar to single end reads’ case.

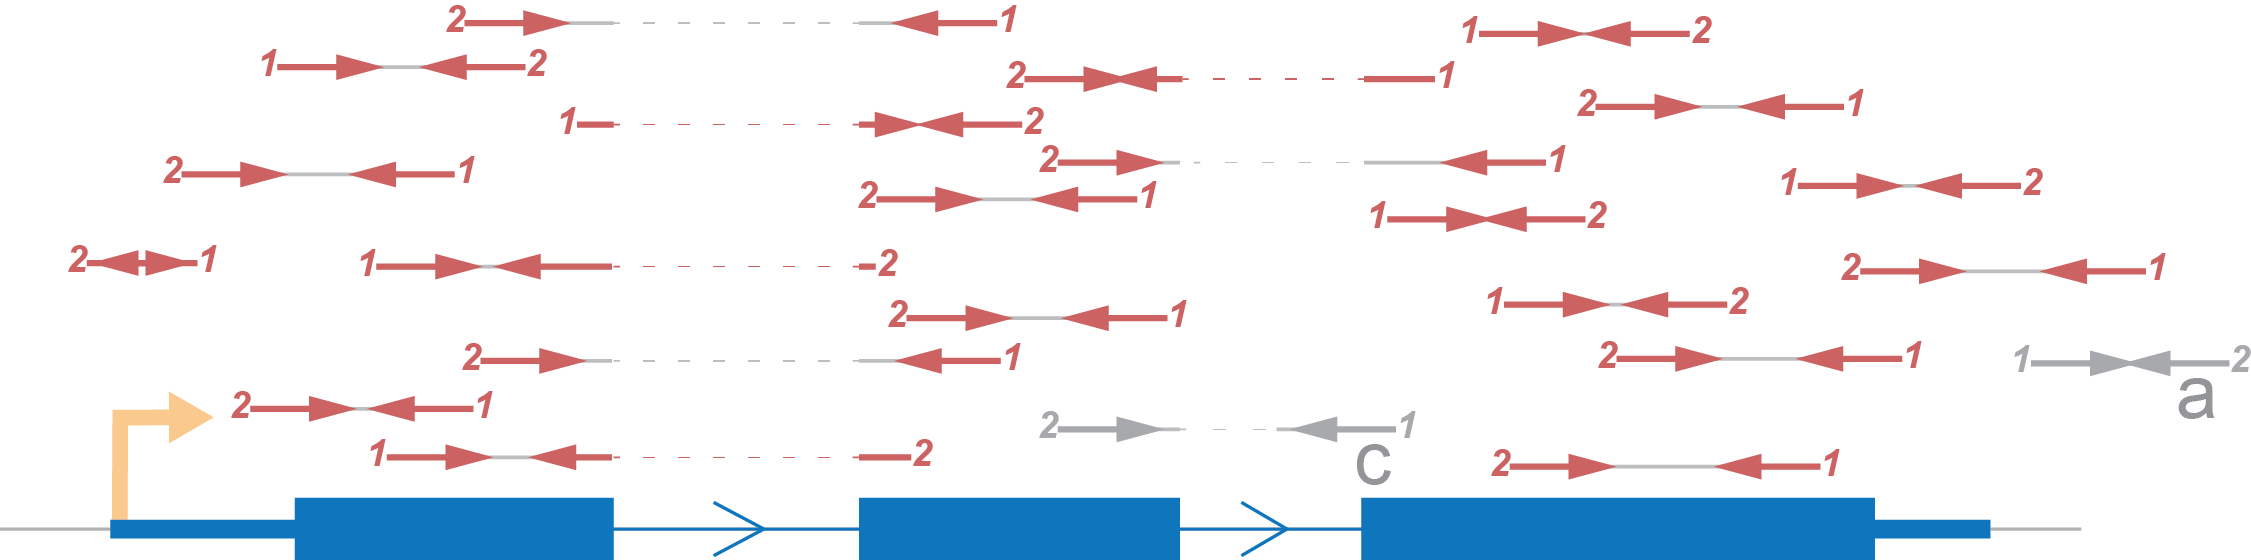
It’s worth to notice that for paired end reads the Persues by default calculates number of fragments for each gene, in other words it doesn’t count twice two reads of one pair.
Hint: In case the experimental design isn’t known, we recommend to use “Not stranded” as “Strand specificity”.
4.4 Genome annotation
Currently the plugin supports GTF file format containing coordinates of genome regions for which the coverage will be calculated. We strongly recommend to download an annotation from the ensemble FTP server.
GTF (General Feature Format): GTF file can start from several browser/track lines (information specific to genome browser) and comment lines (line should begin with the # character). The rest of the file consists of one line per feature, each consists of nine columns
- seqname - name of chromosome of scaffold
- source - name of the program that generated this feature, or the data source (database or project name)
- feature - the current version of Perseus takes into account just “cds” and “exon” features
- start - start position of the feature (1-based coordinate)
- end - end position of the feature (1-based coordinate)
- score - a floating point value
- strand - valid entries include ‘+’ (forward) or ‘-’ (reverse)
- attributes - a semicolon-separated list of tag-value pairs
“empty” columns are denoted with a “.”. Each line with “cds” and “exon” feature should contain “gene_id” or “transcript_id” tags.
4.5 File
Specified file path to the genome annotation.
4.6 Feature type name
It is possible to specify a feature name that will be used (third column of GTF).
Hint: It makes sense to set “Feature type name” parameter to “Exons” for RNA-seq analysis and choose “CDS” for ribosome profiling.
4.7 Number of threads
Specifies the number of used threads for uploading NGS data.
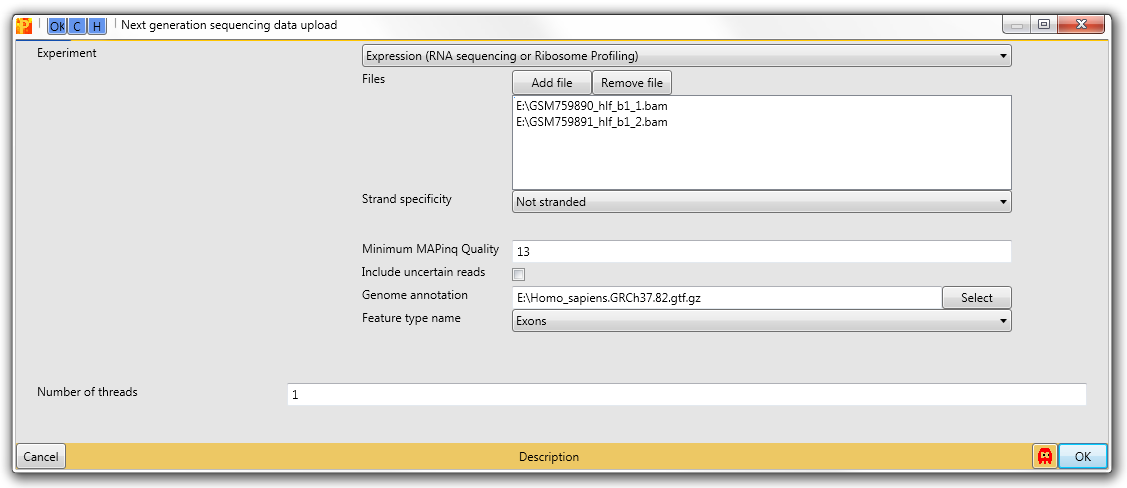
5 Parameter window
6 Examples
6.1 Calculate RPKM/FPKM
- Upload bam files to Perseus. The Required annotation (gtf file) can be found on ensemble’ FTP server (annotation should be in agreement with version of genome which was used for alignment). For the example we took publically available RNA-seq data of cultured primary human lung fibroblast which done in two replicates GSM759890 and GSM759891
- Filter rows based on categorical ‘Gene biotype’ column
- select just protein_coding group.
- Make normalization dividing columns by $sum(Normalization) -> Divide $
- By definition of RPKM, divide previous result by gene length, multiply on \(10^9\) and finally take the \(log_2(Basic -> Combine\ main\ columns)\).
- To get TPM, normalise columns of RPKM/FPKM by sum and multiply on \(10^6\) .
7 Comparison with HTSeq-count
HTSeq-count (Anders, Pyl, and Huber 2014) is part of the HTSeq suite, a python library to facilitate and represent data, such as genomic coordinates, sequences, sequencing reads, alignments, gene model information and variant calls. htseq-count can be used to pre-processes RNA-Seq data for differential expression analysis by counting the overlap of reads with genes. To recreate the plot, one can download the data table below (Mattioni Maturana 2022)
# remotes::install_github("fmmattioni/downloadthis")
library(downloadthis)
download_file(
  path = "htseqvsperseus.table.rar",
  output_name = "HTSeq vs. Persues Table",
  button_label = "Download data table",
  button_type = "info",
  has_icon = TRUE,
  icon = "fa fa-save",
  self_contained = FALSE
)