Perseus
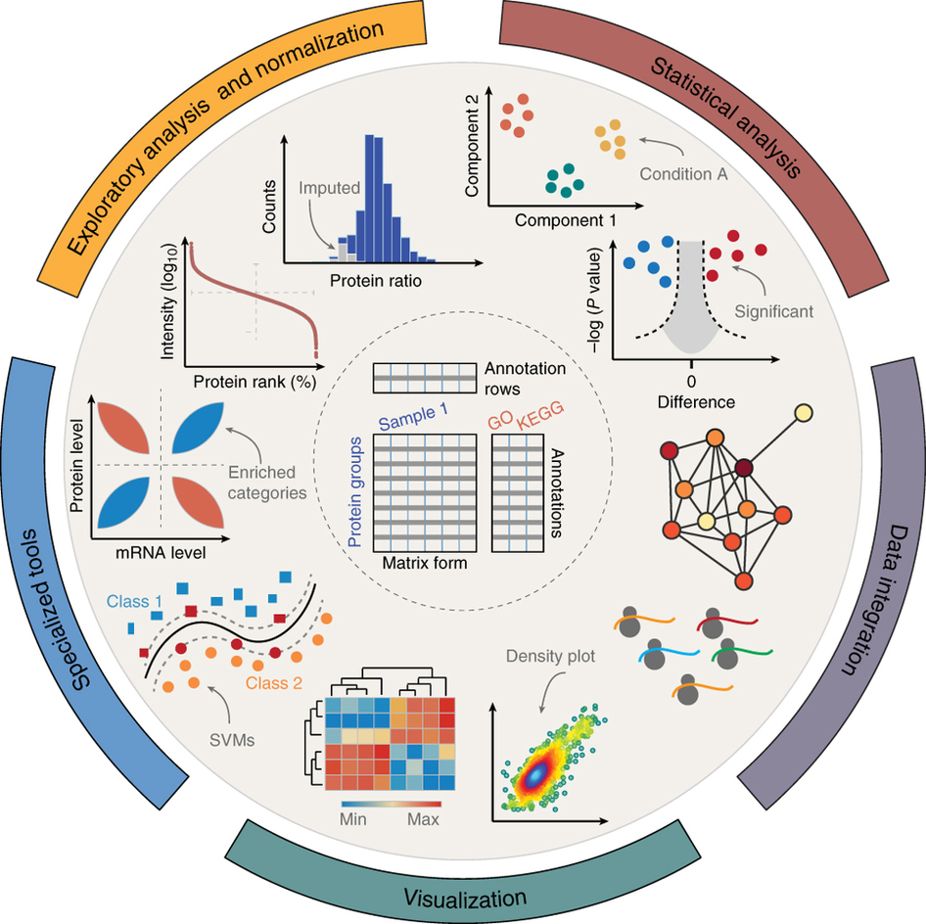
The Perseus software platform supports biological and biomedical researchers in interpreting protein quantification, interaction and post-translational modification data. Perseus contains a comprehensive portfolio of statistical tools for high-dimensional omics data analysis covering normalization, pattern recognition, time-series analysis, cross-omics comparisons and multiple-hypothesis testing (for an overview see Figure 1). A machine learning module supports the classification and validation of patient groups for diagnosis and prognosis, and it also detects predictive protein signatures. Central to Perseus is a user-friendly, interactive workflow environment that provides complete documentation of computational methods used in a publication(Tyanova, Temu, and Cox 2016).
1 Documentation outline
2 Pronunciation of Perseus
Most biologists and informaticians are a little weak in the classical languages. Fortunately, Google helps you catch up on any lessons you missed. The developers in Germany tend to say pair-SAY-oos, with the accent on the second of three syllables, which seems reasonably close to the Greek pronunciation given here] or here. (This pronunciation is distinct from how Germans usually call the Greek hero, which is PAIR-soys.)
The English pronunciation uniformly puts the accent on the first syllable: PER-see-uhs, as in the examples here, here, or here. For the software there is no official pronunciation, so no one will tell you you are wrong, as long as you say it with confidence.
3 Learn
- Hands-on tutorials and theoretical lectures are available on the MaxQuant youtube channel.
- Participate in our annual MaxQuant summer school to gain even deeper insights into MaxQuant and Perseus. Read the protocol-style book chapter ((Tyanova and Cox 2018) on Perseus.
- Join the discussion around Perseus and data analysis on the perseus google group – a great place to ask any question and get answers from the community.
4 Cite
If you use Perseus in your project, please cite one of the papers listed below:
The Perseus computational platform for comprehensive analysis of (prote)omics data (Tyanova, Temu, et al. 2016)
A network module for the Perseus software for computational proteomics facilitates proteome interaction graph analysis (Rudolph and Cox 2019)
Proteomic maps of breast cancer subtypes (Tyanova, Albrechtsen, et al. 2016)
1D and 2D annotation enrichment: a statistical method integrating quantitative proteomics with complementary high-throughput data (Cox and Mann 2012)
4.1 Report a bug
For question we would love to hear from you under Contact