Perseus User Interface
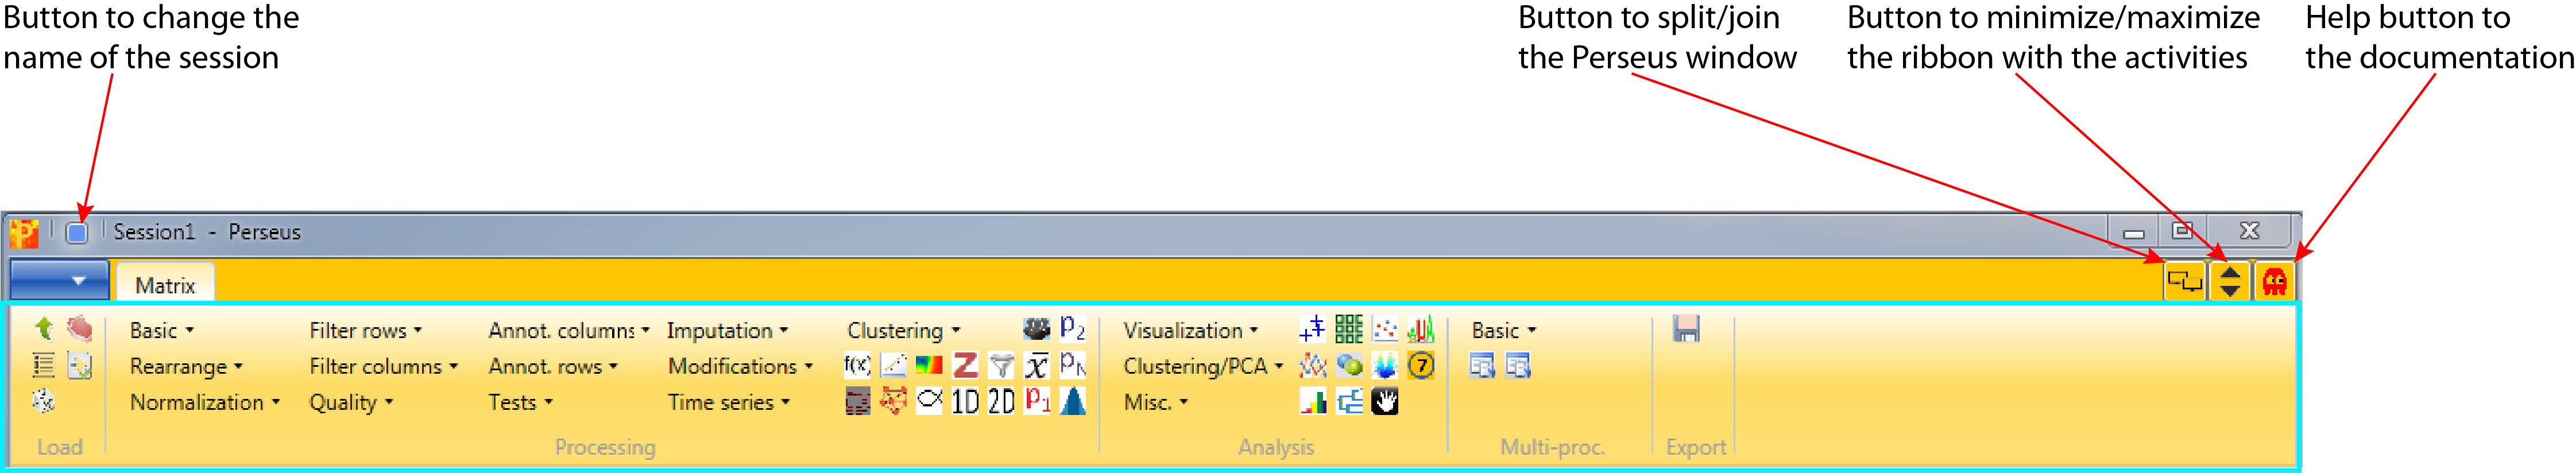
The title bar along the top has the Perseus logo on the left, followed by an icon that can be used to rename the session, which will be displayed and is by default “Session 1 - Perseus”. The bar below (Figure 1) has on the left a menu (indicated by the blue box with a white arrow on it) with the usual sorts of file functions (Save, Save as, Save as PDF, Open, New, New Window, Annotation Download, Help, Exit), followed by a tab label “Matrix”. On the right are buttons to split/join the Perseus window, minimize/maximize the ribbon with all the activities and the last button redirects to the documentation. The ribbon of the “Matrix” tab contains all the activities (highlighted by a cyan rectangle) that can be applied to loaded matrices.
The activities can be divided into five main categories. The icons of the categories Processing, Analysis and Multi-proc. are frequently used activities, which are also listed in one of the drop down menus of each category. To figure out the function behind the icon just hover over it. For simplicity the icons of these three categories are ignored in the listing below:
0.1 Load
0.2 Processing
0.2.1 Basic
0.2.2 Rearrange
- Change column type
- Rename columns
- Rename columns (reg. ex.)
- Combine annotations
- Duplicate columns
- Reorder/remove columns
- Remove empty columns
- Transpose
- Sort by column
- Expand multi-numeric and string columns
- Unique values
- Convert multi-numeric column
- Combine categorical columns
- Process text column
- Search text column
0.2.3 Normalization
0.2.4 Filter rows
0.2.5 Filter columns
0.2.6 Quality
0.2.7 Annot. columns
0.2.8 Annot. rows
0.2.9 Tests
0.2.10 Imputation
0.2.11 Modifications
0.2.12 Clustering
0.3 Analysis
0.3.1 Visualization
0.3.2 Clustering/PCA
0.3.3 Misc.
0.4 Multi-proc.
0.4.1 Basic
0.5 Export
1 Bottom part of the user Interface
The remainder of the window is divided into scrollable panes (Figure 2):
- The matrix pane (highlighted by a pink rectangle)
- The workflow pane (highlighted by a blue rectangle)
- The meta-data pane (highlighted by a green rectangle).
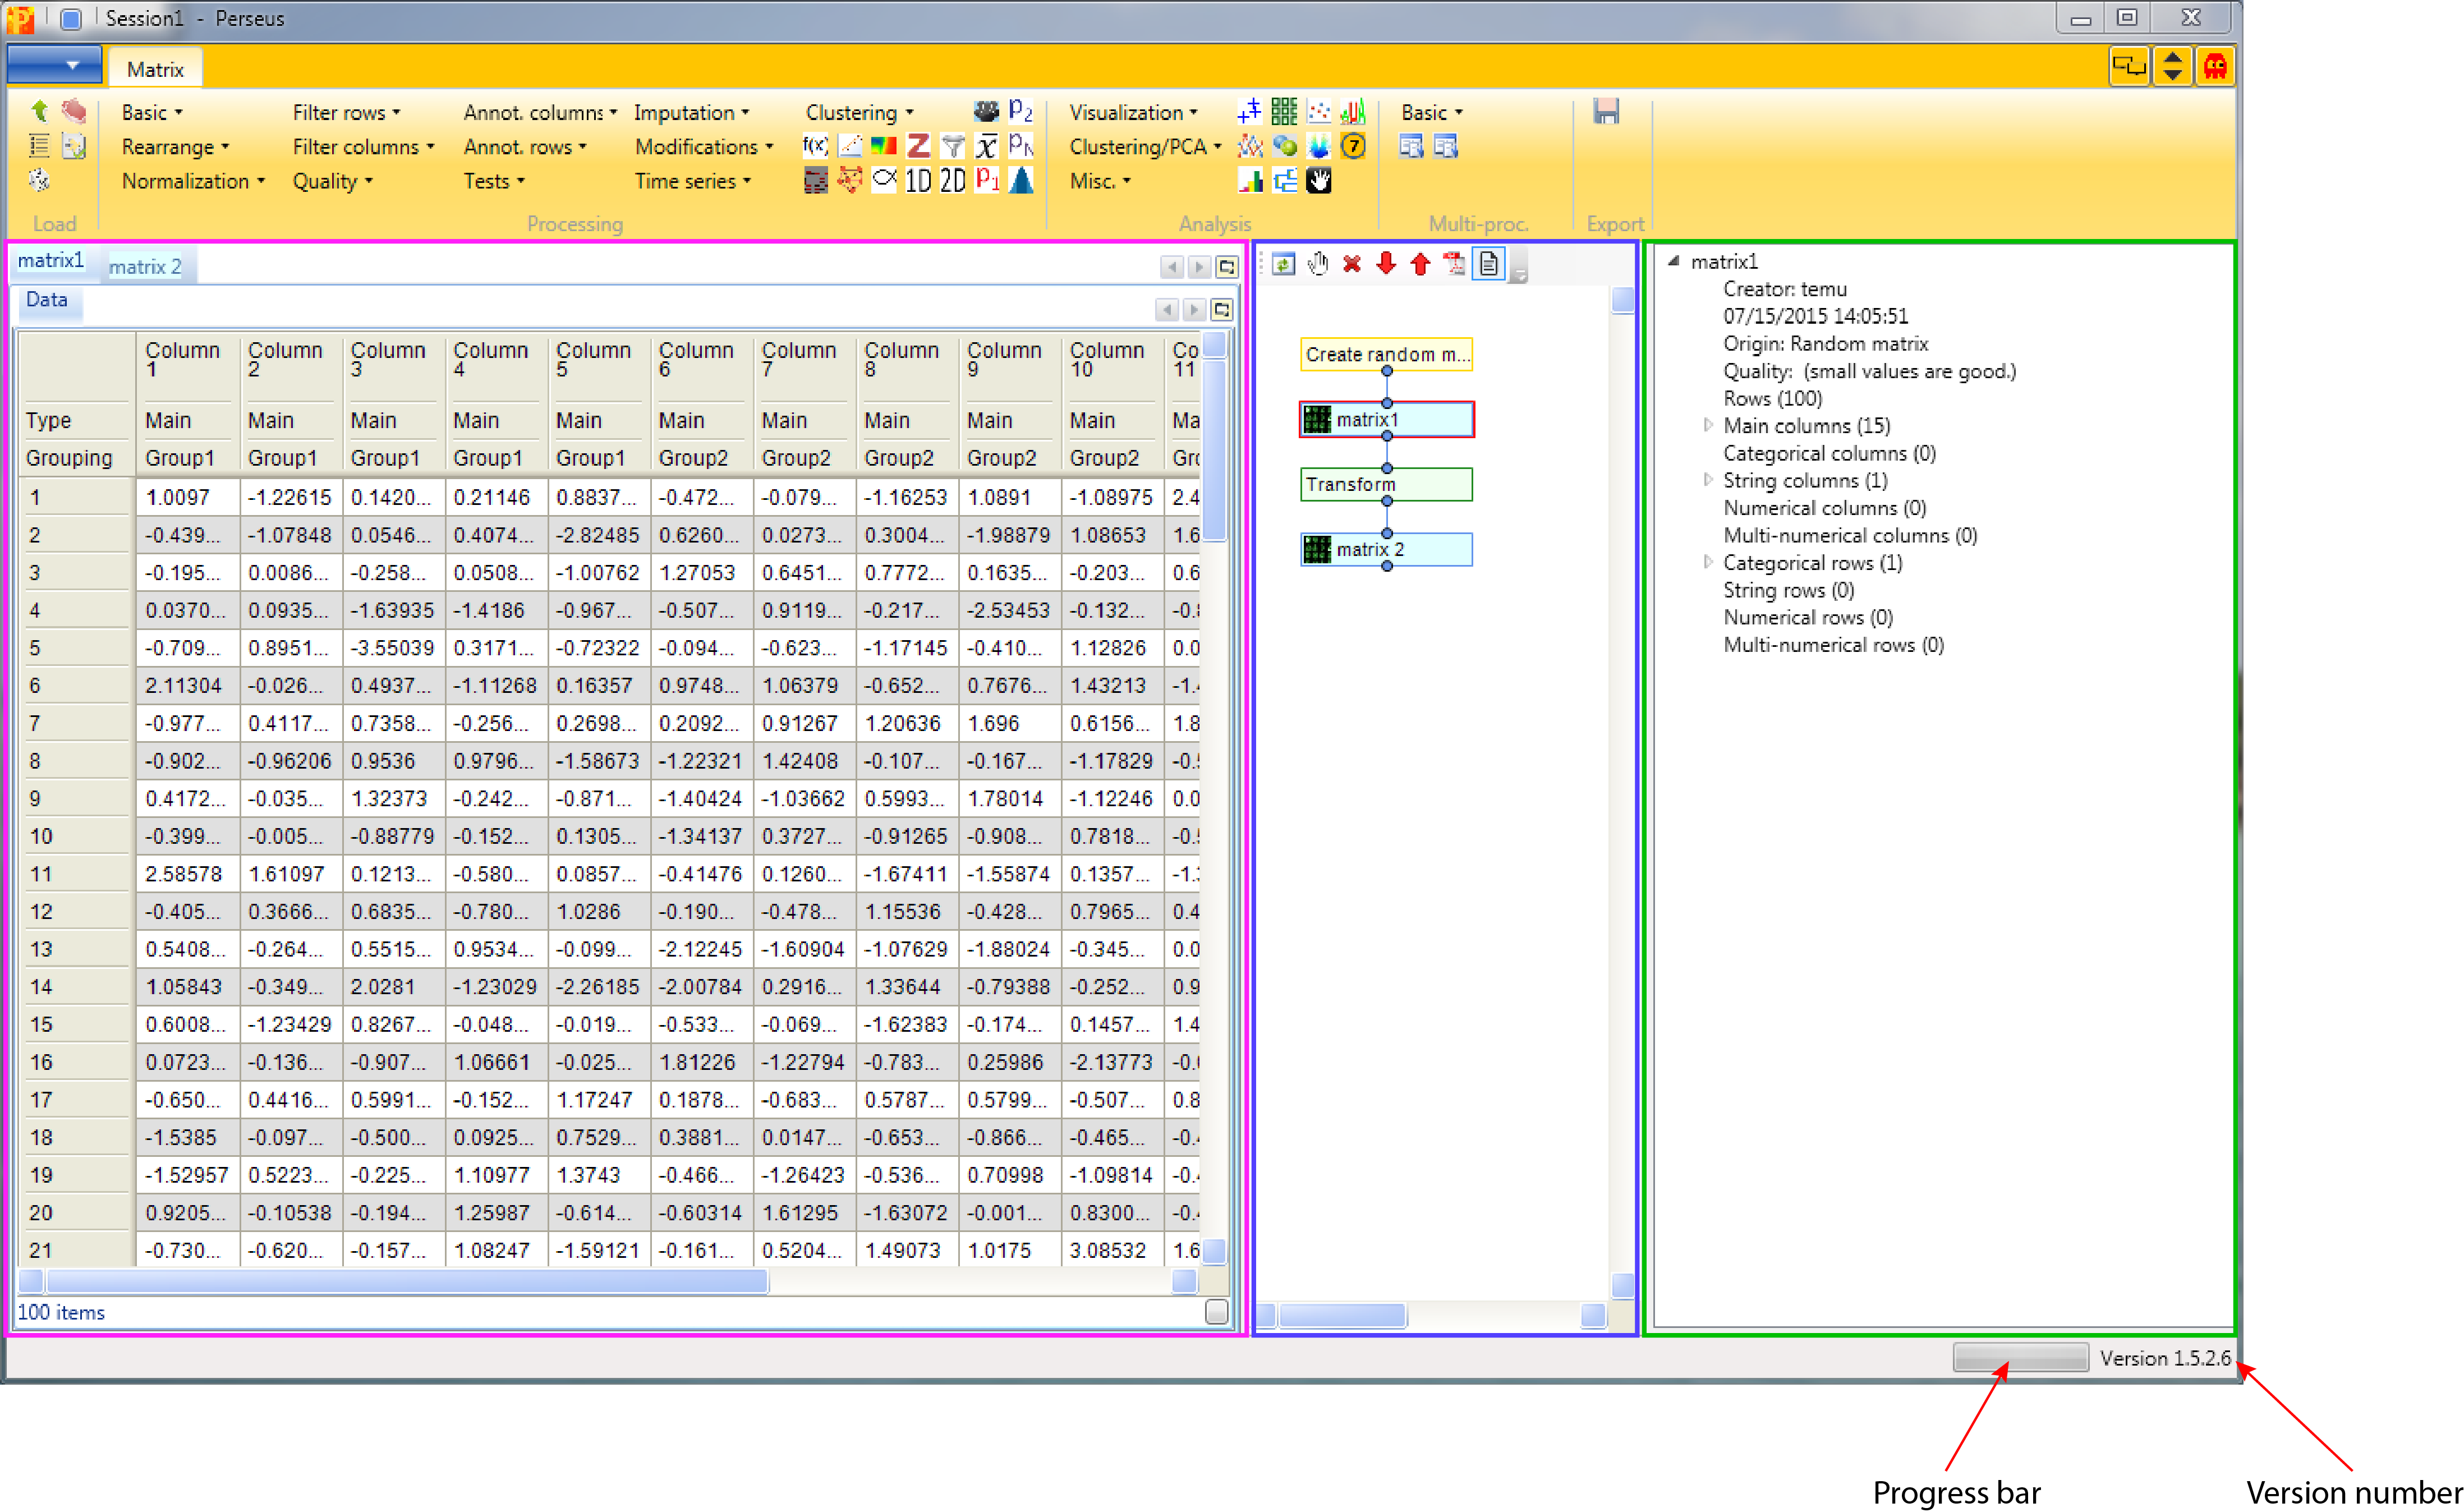
The matrix pane on the left, displays the matrix that is currently selected in the workflow pane including all the columns and rows of that matrix. In the bottom left corner of that pane you can find the number of rows (items) of the shown matrix.
The workflow pane in the middle, shows all the processing steps that have been applied to your data up to here including the parameter values that have been used. The generated workflow can be rearranged using the drag and drop function. Also matrices can be renamed and highlighted using different colors by right clicking on the node of choice. At the top of this pane you can find important buttons to manipulate the workflow:
- Re-layout: Re-formats the whole workflow to the default arrangement of the workflow
- Stop activity: Stops a currently running process
- Remove selected nodes
- Complete selection downstream: Selects all nodes downstream starting at the picked node
- Complete selection upstream: Selects all nodes upstream starting at the picked node
- Export graphics: Exports the workflow as a graphic
The meta-data pane on the right, gives meta-information of a selected node. If a matrix node is selected you get information about the matrix, its creator and when it was created, how many rows and columns it contains, etc. In case an activity node is selected information about the used parameters can be retrieved and if necessary be double checked.
In the bottom right corner of the Perseus window are a progress bar and the version number.
Comment: In the newest Perseus version we changed the terminology of expression columns to main columns. The functionality of these columns is equivalent.