1D annotation enrichment
1 General
- Type: - Matrix Processing
- Heading: - Annot. columns
- Source code: not public.
2 Brief description
For every term in the categorical columns it is tested whether the corresponding expression values have a preference to be systematically larger or smaller than the global distribution of expression values.
For details see Cox and Mann (2012) (Cox and Mann 2012) (Suppl. 16:S12).
Output: The output matrix contains a list of terms from all categorical columns that are significantly biased towards low or high values in the expression columns.
3 Parameters
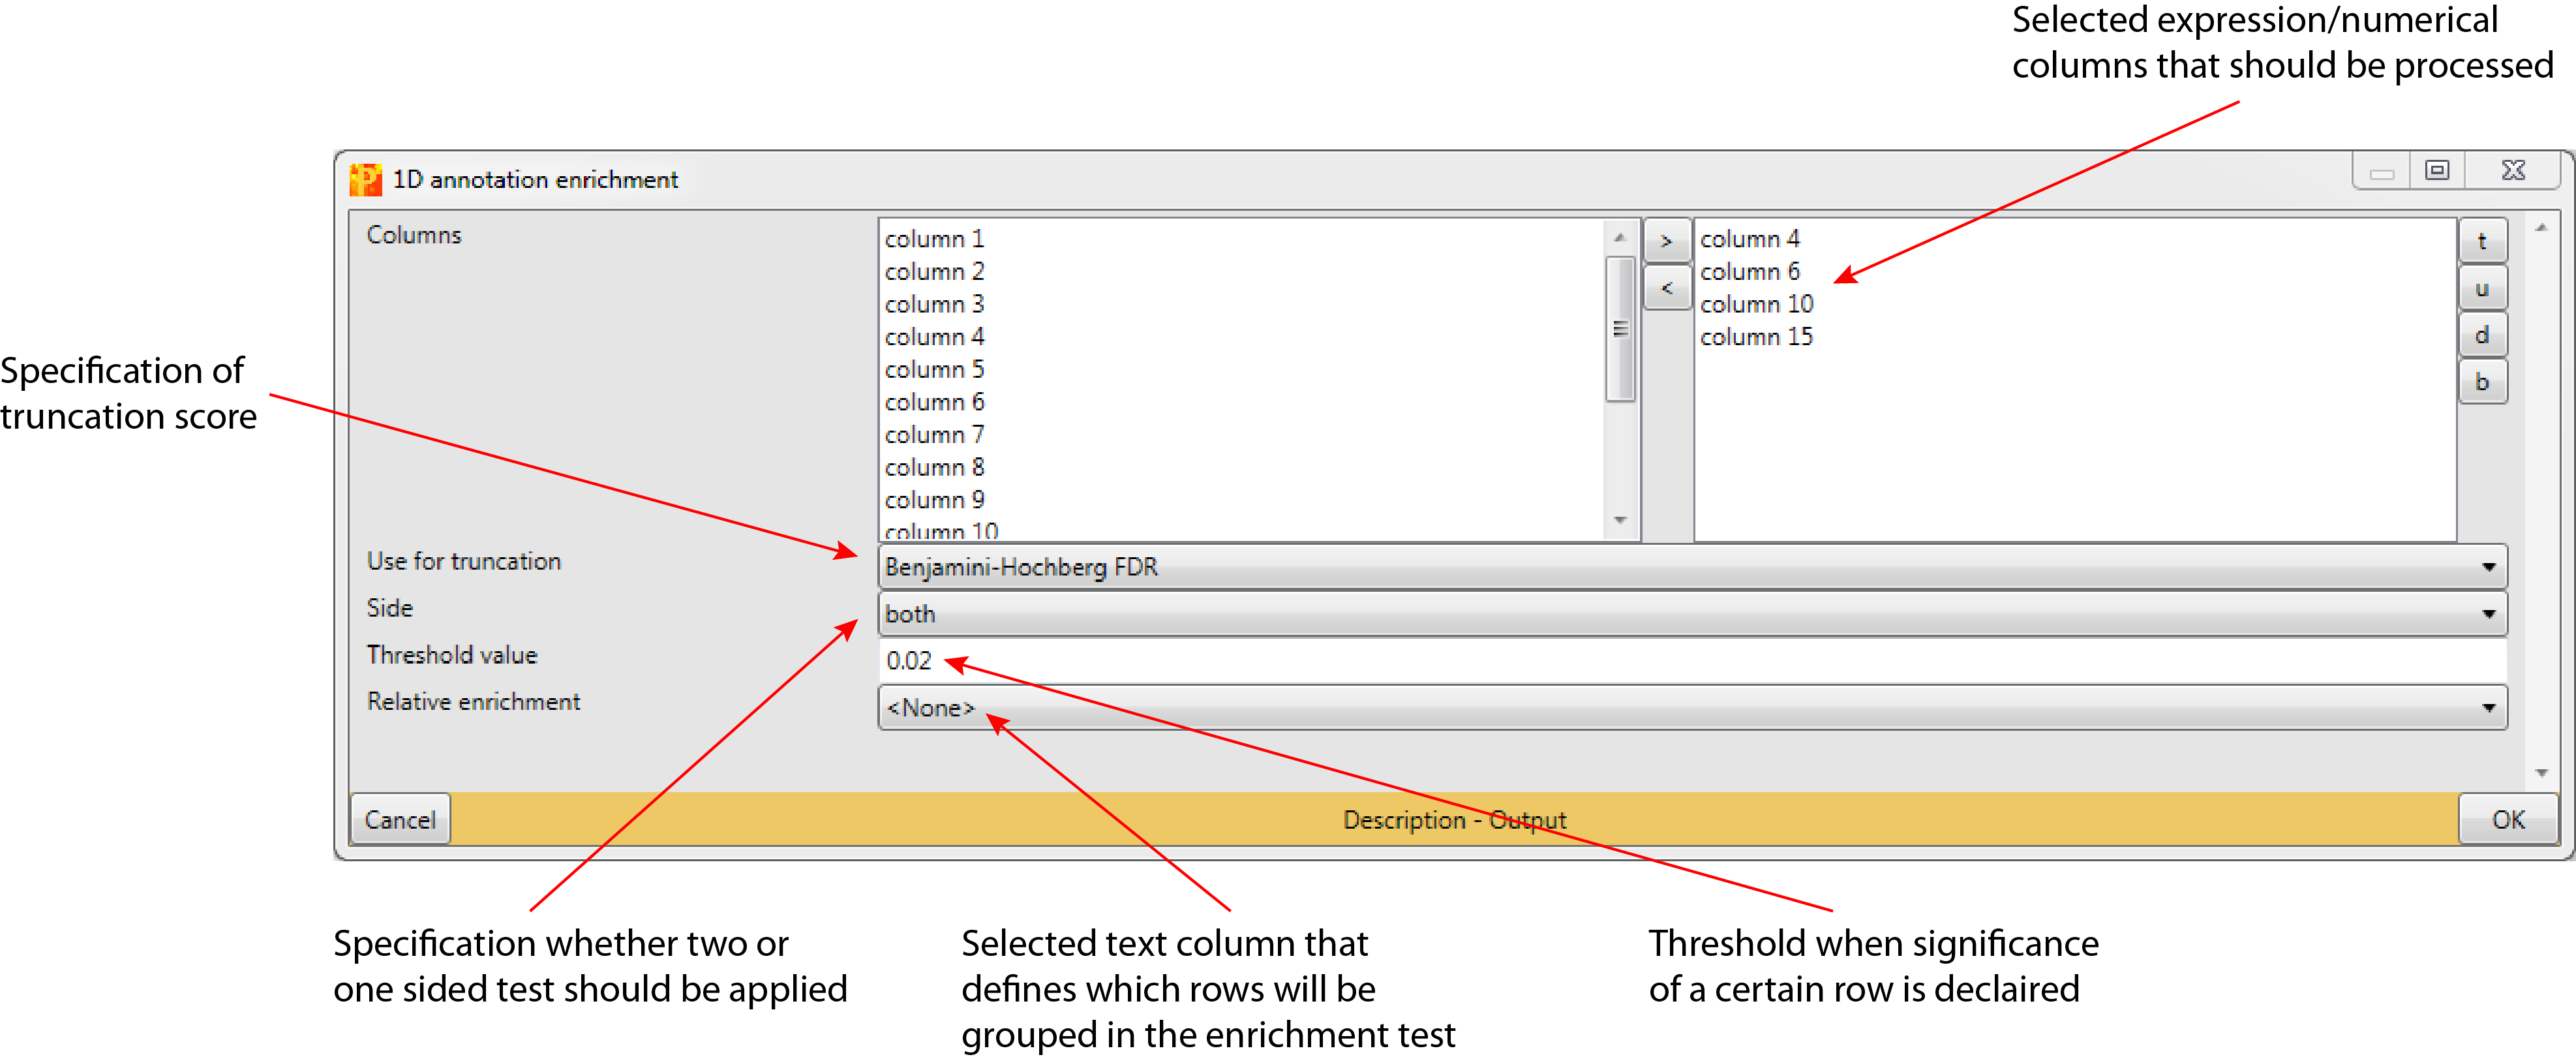
3.1 Columns
Selected expression/numerical columns that should be processed (default: no expression/numerical columns are selected).
3.2 Use for truncation
The truncation can be based on p-values or the Benjamini-Hochberg correction for multiple hypothesis testing (default: Benjamini-Hochberg FDR). Rows with a test result below a specified value (“Threshold value”) are reported as significant.
3.3 Side
To apply a two-sided test, where the null hypothesis can be rejected regardless of the direction of the effect “both” has to be selected (default). “high” and “low” are the respective one-sided tests.
3.4 Threshold value
Based on a specified threshold (default: 0.02) a row is reported as significant, if its test result is below the defined value. Depending on the chosen truncation score this threshold value is applied to the p-value or to the Benjamini-Hochberg FDR
3.5 Relative enrichment
Selected text column, where all rows having the same identifier will be counted as one entity in the 1D annotation enrichment analysis (default: <None>). The main application is for posttranslational modification sites. Then one should select here protein or gene identifiers. This will make sure that multiple sites from the same protein (or gene) are counted only once for the enrichment analysis.
4 Parameter window