Volcano plot
1 General
- Type: - Matrix Analysis
- Heading: - Misc. (Analysis)
- Source code: not public.
2 Brief description
Visualize the results of a t-test in the form of a volcano plot. Determine significant data points with a permutation-based FDR calculation.
3 Parameters
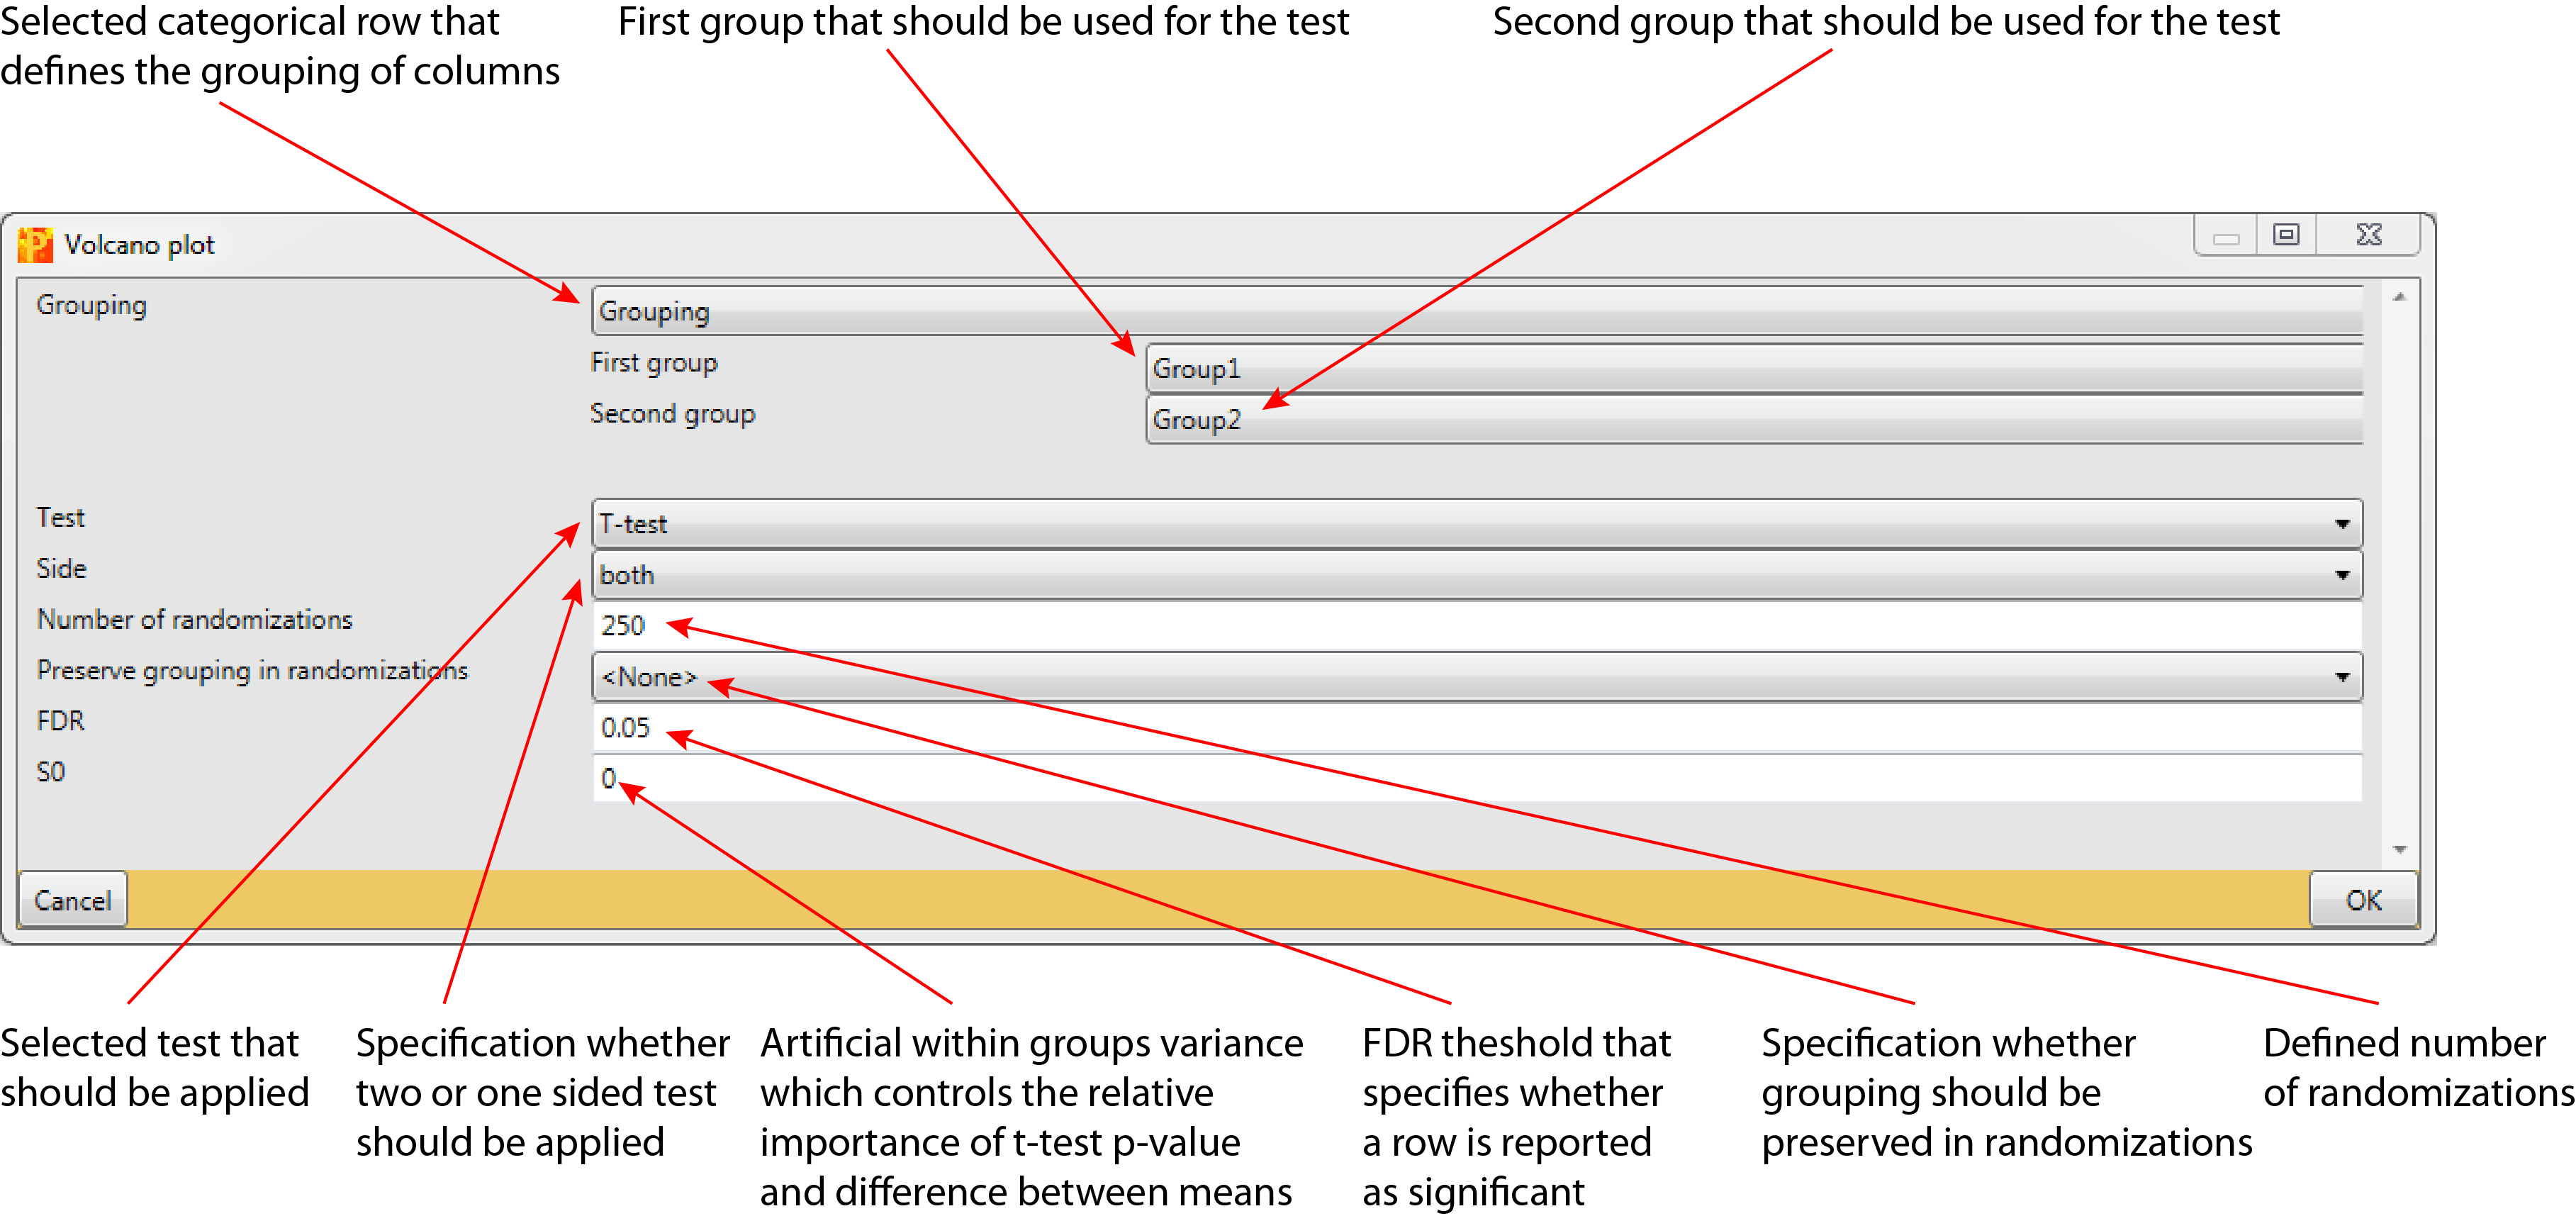
3.1 Grouping
Selected categorical row that defines the grouping of columns that should be used in the specified “Test” (default: first categorical row in the matrix).
3.1.1 First Group (right)
First selected group that should be used for the specified “Test” (default: first group of the previously selected categorical row in the matrix). The group can be selected from all defined groups of the categorical row defined in “Grouping”.
3.1.2 Second Group (left)
Second selected group that should be used for the specified “Test” (default: first group of the previously selected categorical row in the matrix). The group can be selected from all defined groups of the categorical row defined in “Grouping”.
3.2 Test
Defines what kind of test should be applied (default: T-test).
3.3 Side
To apply a two-sided test, where the null hypothesis can be rejected regardless of the direction of the effect “both” has to be selected (default). “left” and “right” are the respective one-sided tests.
3.4 Number of randomizations
Specifies the number of randomizations that should be applied (default: 250).
3.5 Preserve grouping in randomizations
Defines, whether the grouping specified in a categorical row should be preserved in the randomizations (default: <None>). It can be selected from a list including all available groupings of the matrix.
3.6 FDR
Rows with a test result below this value are reported as significant (default: 0.05).
3.7 S0
Artificial within groups variance (default: 0). It controls the relative importance of t-test p-value and difference between means. At s0=0 only the p-value matters, while at nonzero s0 also the difference of means plays a role. See (Tusher, Tibshirani, and Chu 2001) for details.
4 Parameter window