Two-sample tests
1 General
- Type: - Matrix Processing
- Heading: - Tests
- Source code: not public.
2 Brief description
Two sample-test for determining if the means of two groups are significantly different from each other.
Output: Two numerical columns are added per test, one containing the p-value, the other containing the difference between the means. In addition there is a categorical column added in which it is indicated by a ‘+’ when the row is significant with respect to the specified criteria. If applicable, another column is added per test with test-specific q-values. Also, depending on the parameter settings two columns with global information (over all tests) are added with a combined score and combined q-value.
3 Parameters
3.1 Grouping
The grouping(s) of columns to be used in the test. Each test takes two groups as input. Multiple tests can be performed simultaneously by specifying more than one pair of groups.
3.1.1 First group (right)
All ‘right’ groups of the two sample tests are defined here. The number of groups selected here equals the number of different tests performed.
3.1.2 Second groups mode
Specify here how the ‘left’ groups of the two sample tests are specified. Possible ways are to specify for each individual ‘right’ group the corresponding ‘left’ group, to use one single control group, or to always use the complement of each individual ‘right’ group as the ‘left’ group.
3.2 Test
Defines what kind of test should be applied (default: T-test). The test can be selected from a predefined list:
- T-test
- Welch test
3.2.1 S0
This parameter defines the artificial within groups variance (default: 0). It controls the relative importance of the resulted p-value and difference between means. At \(s0=0\) only the p-value matters, while at nonzero s0 also the difference of means plays a role. See (Tusher, Tibshirani, and Chu 2001) for details.
3.2.2 Side
To apply a two-sided test, where the null hypothesis can be rejected regardless of the direction of the effect “both” has to be selected (default). “left” and “right” are the respective one-sided tests.
3.3 Valid value filter
Specify here how rows are filtered regarding the number and percentage of valid values. This criterion will be applied to each test individually, not just once to the whole matrix. The absolute number and relative percentage filters are both applied together.
3.3.1 Min. number of valid values
Here the required number of valid values is specified. How this threshold is applied (in total, per group, etc.) is specified in the next field.
3.3.2 Min. number mode
Specify here how the threshold is applied.
3.3.3 Min. percentage of valid values
Here the required percentage of valid values is specified. How this threshold is applied (in total, per group, etc.) is specified in the next field. Values can range from 0 to 100.
3.3.4 Min. percentage mode
Specify here how the above threshold is applied.
3.4 Use for truncation
Defines on what value the truncation is based on (default: Permutation-based FDR). Choose here whether the truncation should be based on the p-values, on permutation-based FDR values or, if the Benjamini-Hochberg correction for multiple hypothesis testing should be applied.
3.4.1 Threshold p-value
This parameter is just relevant, if the parameter “Use for truncation” is set to “P-value”. Rows with a test result below this value are reported as significant (default: 0.05).
3.4.2 FDR
This parameter is just relevant, if the parameter “Use for truncation” is set to “Benjamini-Hochberg FDR” or “Permutation-based FDR”. Rows with a test result below this value are reported as significant (default: 0.05).
3.4.3 Number of randomizations
Specifies the number of randomizations that should be applied (default: 250).
3.4.4 Preserve grouping in randomizations
Defines, whether the grouping specified in a categorical row should be preserved in the randomizations (default: <None>). It can be selected from a list including all available groupings of the matrix.
3.5 Calculate combined score
In case multiple two sample tests are performed, the combined score helps to define a global set of significant items over all the tests combined. A global q-value can be calculated based on permutations of the whole matrix.
3.5.1 Mode
Here the user can define the combined score which is either the p-value from the best test or the product over all tests.
3.5.2 Combined q-value
In case this is checked, a combined q-value based on the combined score and permutations of the whole matrix is calculated.
3.6 -Log10
If checked, \(-Log_{10}(test\ value)\) is reported in the output matrix (default). Otherwise the test-value is reported.
3.7 Suffix
The entered suffix will be attached to newly generated columns (default: empty). That way columns from multiple runs of the test can be distinguished more easily.
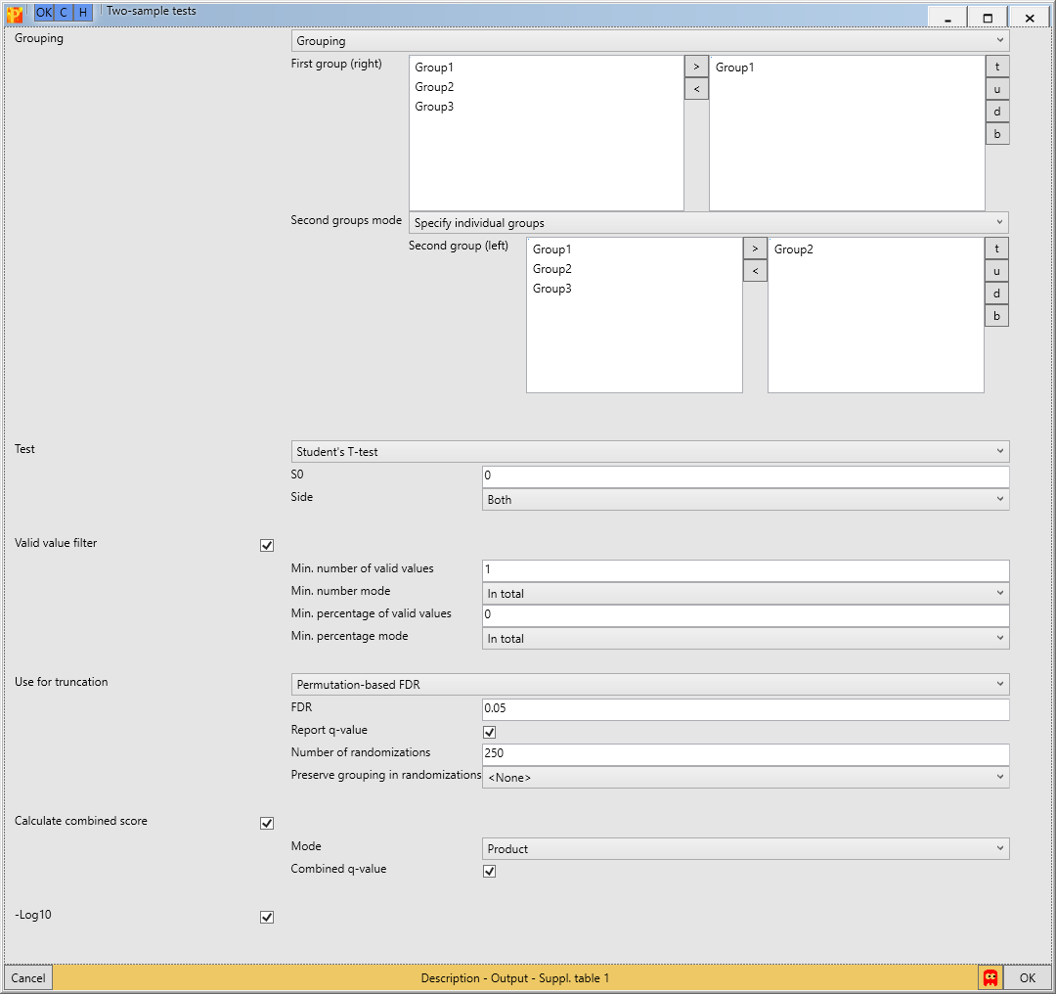
4 Parameter window