Scatter plot analysis
1 General
- Type: - Matrix Analysis
- Heading: - Visualization
- Source code: not public.
2 Brief description
Plot two columns or two rows against each other as \(x\) and \(y\) values in a scatter plot. Data points can be colored according to values in a third column or row.
3 Parameters
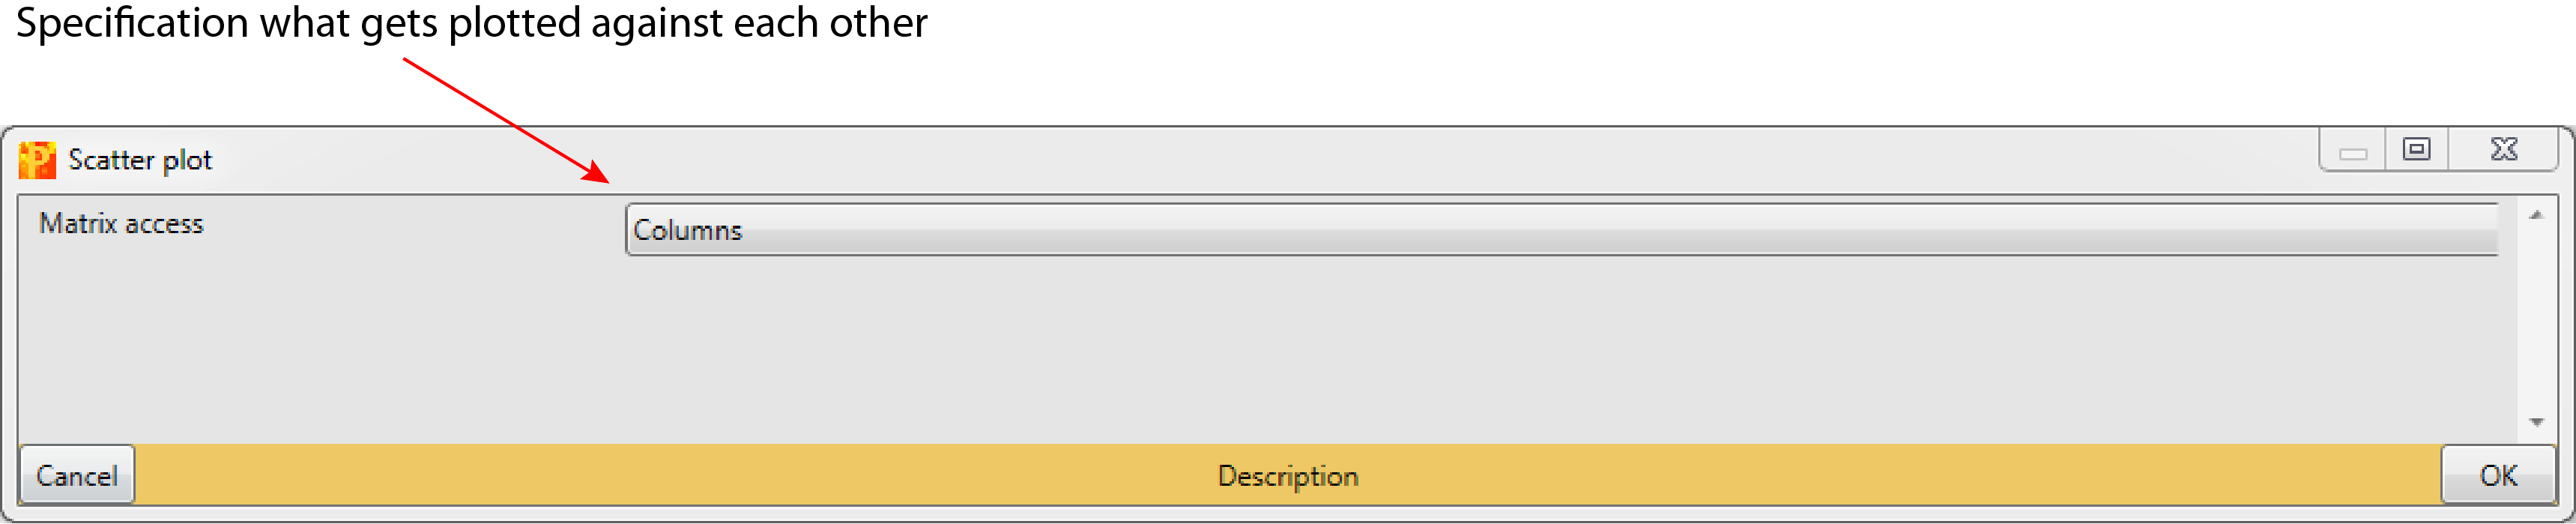
3.1 Matrix access
Specifies whether columns (default) or rows are plotted against each other.
4 Parameter window