Performance curves
1 General
- Type: - Matrix Processing
- Heading: - Basic (Processing)
- Source code: PerformanceCurves.cs
2 Brief description
Calculation of predictive performance measures like precision-recall or ROC curves.
#Parameters
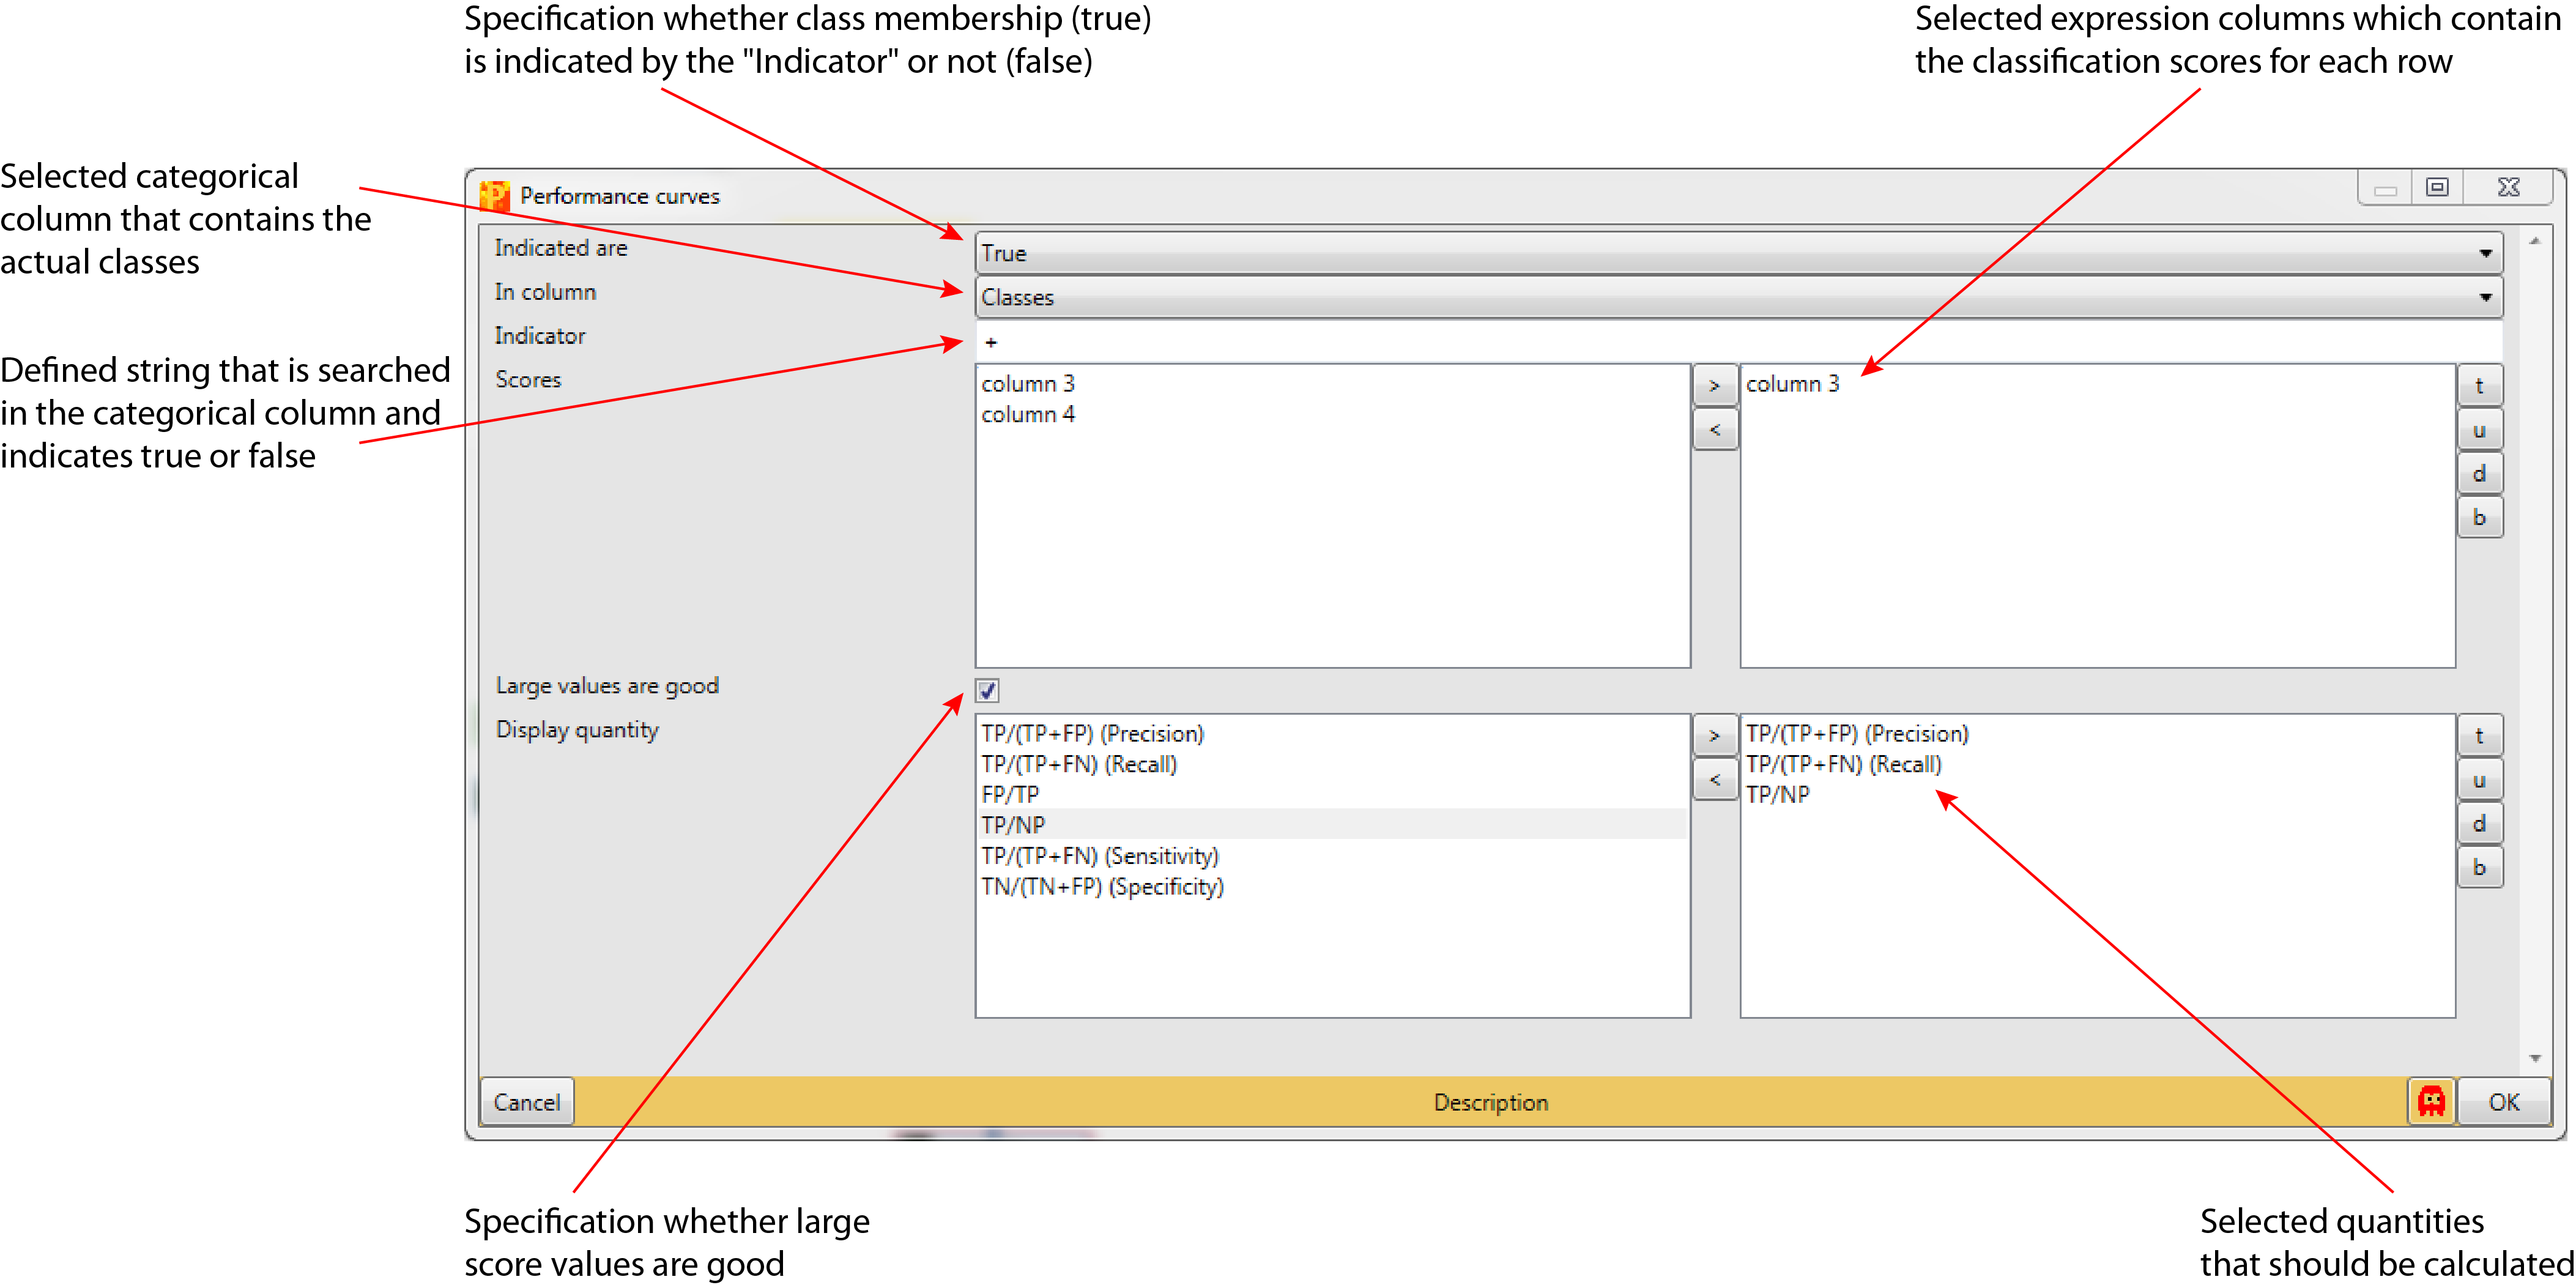
2.1 Indicated are
Specification whether rows containing the “Indicator” in the categorical column specified in “In column” correspond to the class under observation or not (default: False).
2.2 In column
Selected categorical column containing the class membership of each instance (row) of the class under observation (default: first categorical column in the matrix).
2.3 Indicator
Rows containing the defined string are counted as true or false depending on the selection in “Indicated are” (default: \(+\)).
2.4 Scores
Selected expression columns containing the scores by which the rows are ranked to calculate the specified quantities (default: first expression column of the matrix is selected).
2.5 Large values are good
If checked the larger the score value the better (default: checked). Otherwise the lower the value the better.
2.6 Display quantity
Selected quantities that will be calculated (default: no quantities are selected). The quantities can be selected from a predefined list:
- \(TP/(TP+FP)\) (Precision)
- \(TP/(TP+FN)\) (Recall)
- \(FP/TP\)
- \(TP/NP\)
- \(TP/(TP+FN)\) (Sensitivity)
- \(TN/(TN+FP)\) (Specificity)
3 Parameter window