Significance A
1 General
- Type: - Matrix Processing
- Heading: - Outliers
- Source code: SignificanceA.cs
2 Brief description
Determines which values are significant outliers relative to a certain population. For details see Cox and Mann (Cox and Mann 2008)
Output: A numerical column is added containing the significance A value. Furthermore, a categorical column is added indicating by ‘+’ if a row is significant.
3 Parameters
3.1 Columns
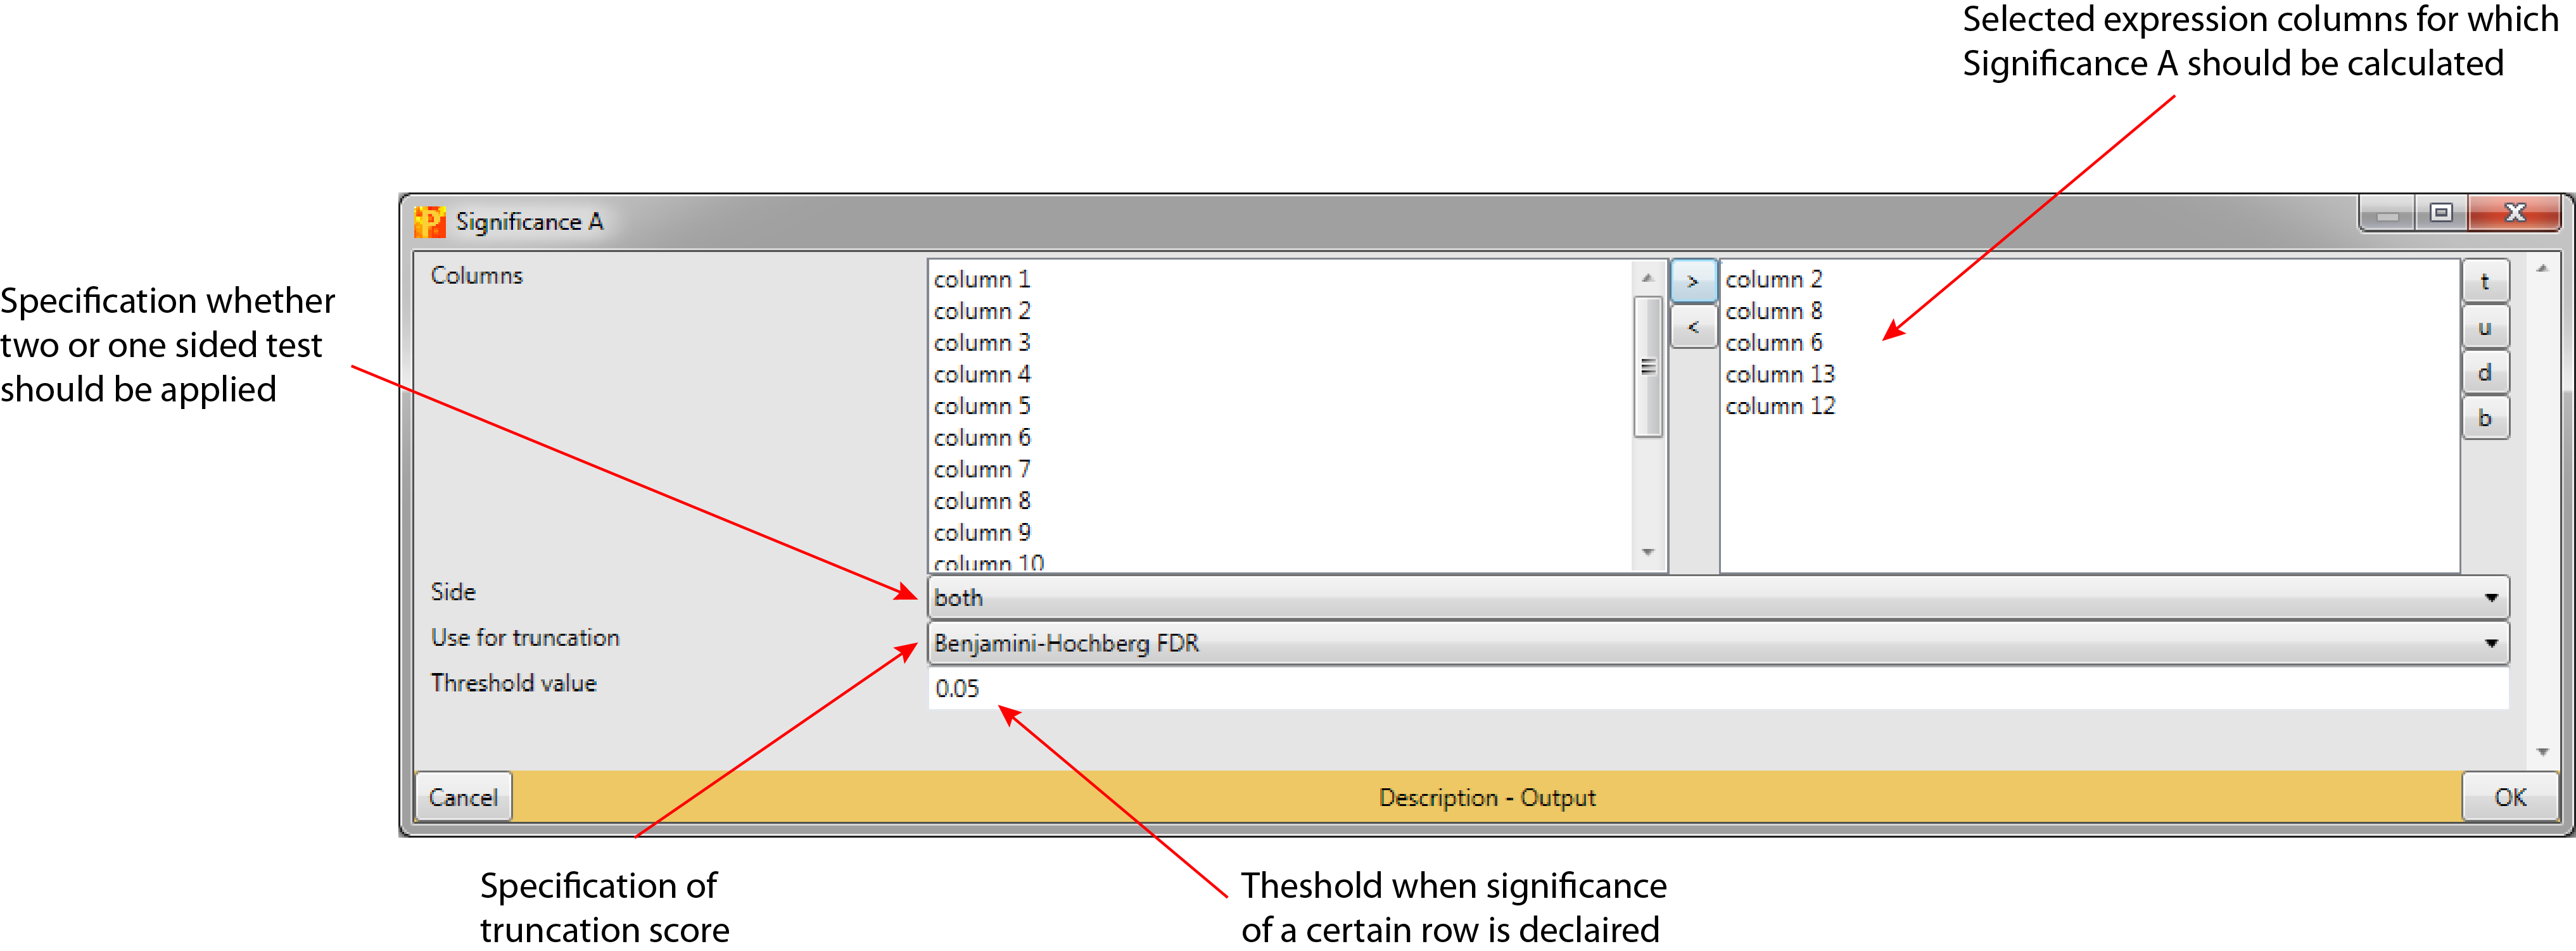
Selected expression columns for which “Significance A” should be calculated (default: no expression columns are selected).
3.2 Side
To apply a two-sided test, where the null hypothesis can be rejected regardless of the direction of the effect “both” has to be selected (default). “left” and “right” are the respective one-sided tests.
3.3 Use for truncation
The truncation can be based on p-values or the Benjamini-Hochberg correction for multiple hypothesis testing (default: Benjamini-Hochberg FDR). Rows with a test result below a specified value (parameter below) are reported as significant.
3.4 Threshold value
Based on a specified threshold a specific row is reported as significant (default: 0.05). Depending on the chosen truncation score this threshold value is applied to the p-value or to the Benjamini-Hochberg FDR.
4 Parameter window