Summary statistics (rows)
1 General
- Type: - Matrix Processing
- Heading: - Basic (Processing)
- Source code: SummaryStatisticsRows.cs
2 Brief description
A set of simple descriptive quantities are calculated that help summarizing the expression data in each row.
Output: For each selected summary statistic, a numerical column is added containing the specific quantitiy for each row of expression values. NaN and Infinity values are ignored for all calculations.
3 Parameters
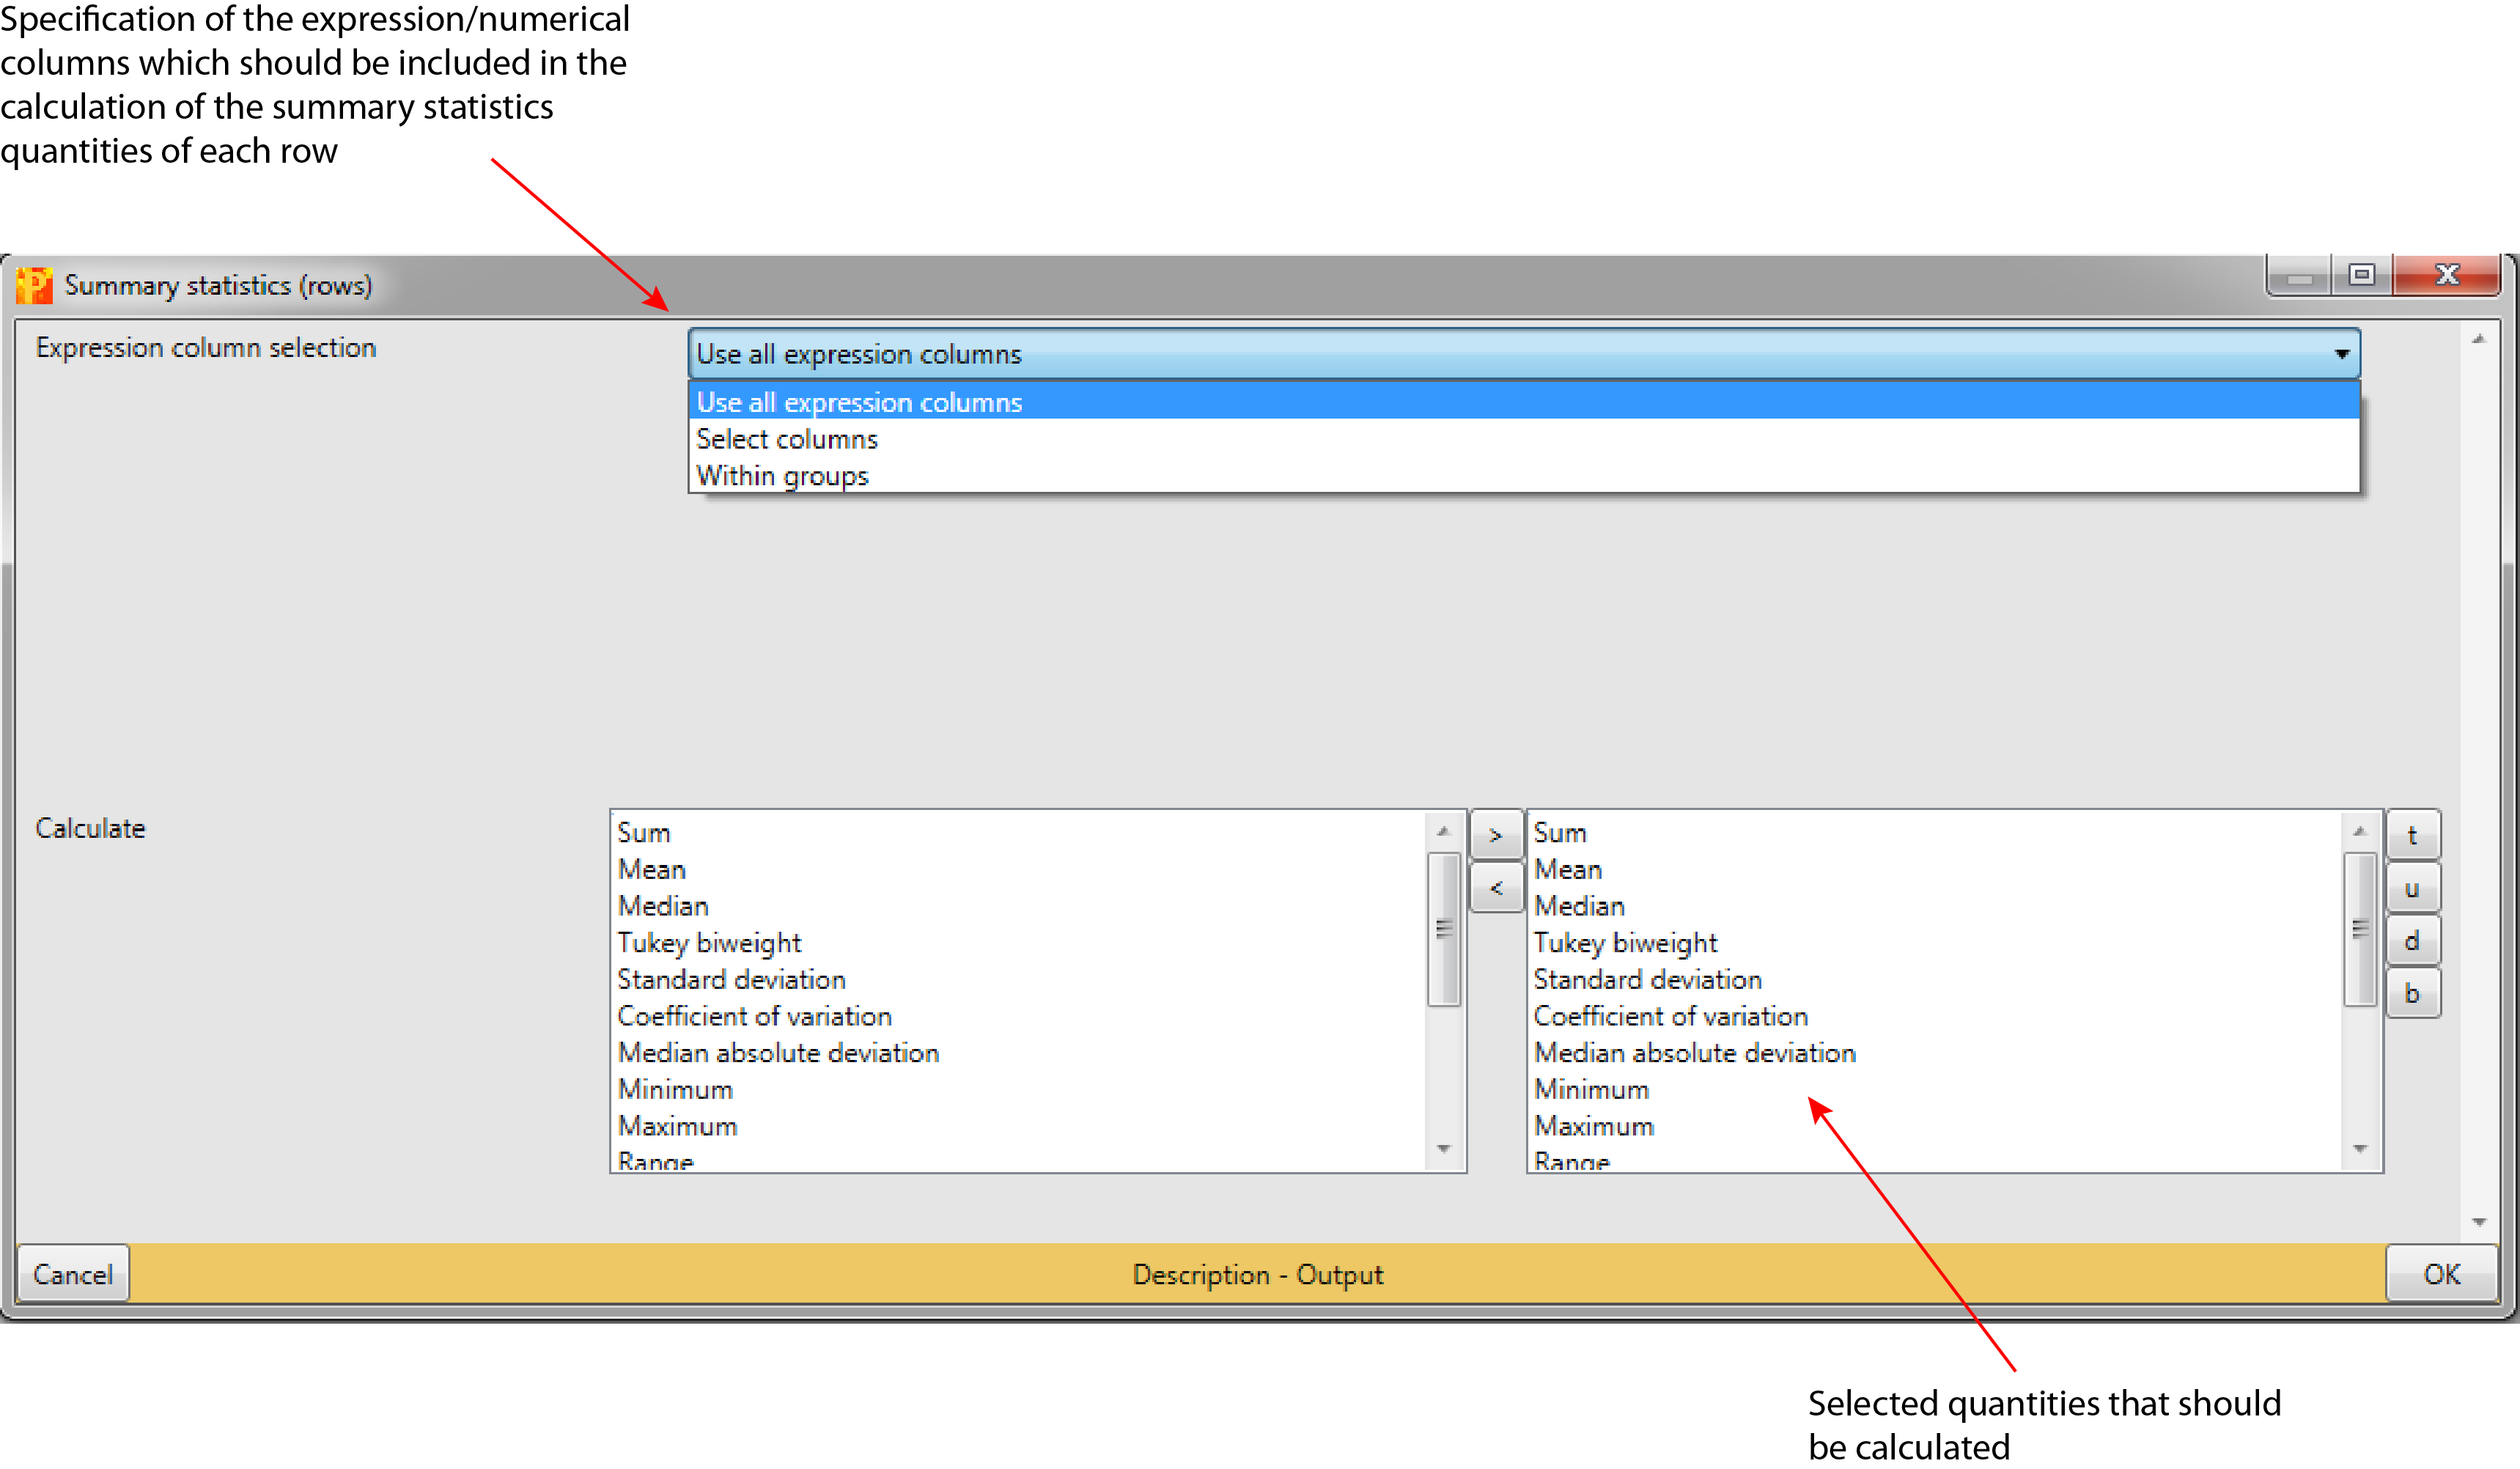
3.1 Expression column selection
Selected expression columns that are used to summarize each row (default: use all expression columns). The way of choosing the expression columns can be specified by selecting one of the three options:
- Use all expression columns
- Select columns
- Within groups
3.1.1 Columns
This parameter is just relevant, if “Expression column selection” is set to “Select columns”. Manually selected expression columns, whose values in each row should be used for the calculation of the defined operations (default: all expression columns are selected).
3.1.2 Group
This parameter is just relevant, if “Expression column selection” is set to “Within groups”. Selected categorical row that defines which values in a row are grouped together to calculate the specified summary values (default: first categorical row in the matrix).
3.2 Calculate
List of quantities that are calculated for the selected columns (default: all of the below listed quantities are selected). The available quantities are:
- Sum
- Mean
- Turkey biweight
- Standard deviation
- Coefficient of variation
- Median absolute deviation
- Minimum
- Maximum
- Range
- Valid values
- Inter-quartile range
- 1st quartile
- 3rd quartile
- Skewness
- Kurtosis
4 Parameter window